

- July 20, 2022
- Posted by: Tradingshot Articles
- Category: Cryptocurrency
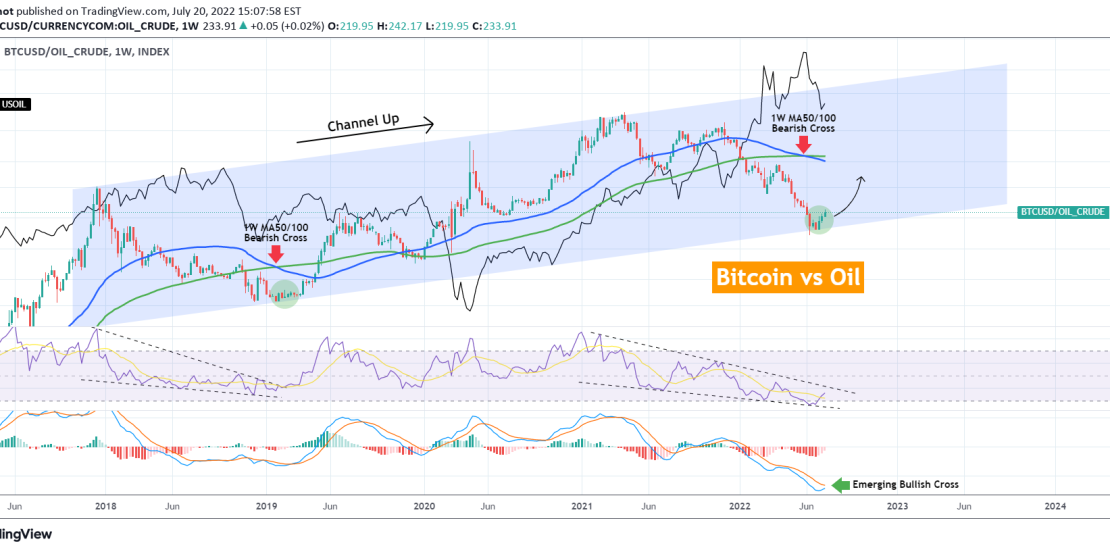
This chart represents the Bitcoin/WTI Oil ratio and reveals an interesting finding regarding where both markets could be headed. Since December 2017, the ratio has been trading within a Channel Up pattern. Following a 1W MA50/100 Bearish Cross (blue trend-line crossing below the green trend-line respectively) in January 2019, the symbol bottomed and started rising, indicating that Bitcoin gained strength against WTI Oil.
Today it appears we have a similar bottom behind us, as WTI Oil (black trend-line) has been dropping aggressively since late May, while BTC has been rising since June 18. Notably, that took place exactly on the Higher Lows trend-line of this 4.5 year old Channel Up. The 1W RSI is about to test the top of its Falling Wedge, just like in February 2019. A break above it, technically confirms the bottom bias and the sentiment for an upcoming rally on Bitcoin.
Basically this tells long-term investors that hold both BTC and WTI contracts, to ease on Oil and start growing their BTC portfolio holdings instead. Attention though, as despite its correction since May, this doesn’t mean that WTI Oil has to drop more necessarily. This chart shows that BTC is more likely to outperform Oil during that time. They can both rise together just like it happened from Jan to April 2019 or October 2020 to April 2021.
Tradingview link: