- July 28, 2022
- Posted by: Tradingshot Articles
- Category: Cryptocurrency

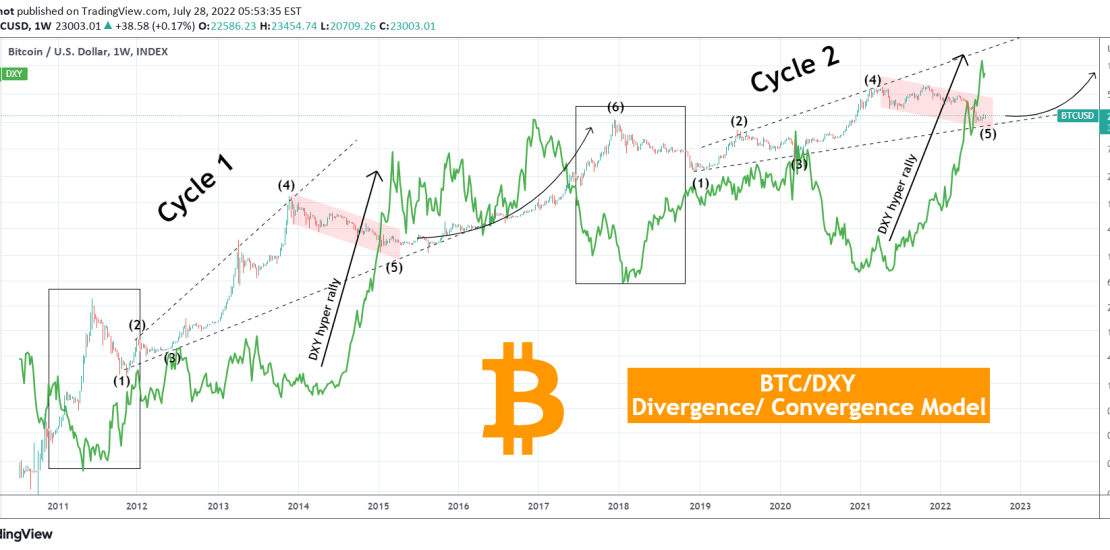
This is an alternative representation of Bitcoin (BTCUSD) and its Cyclical behavior based on the long-term price action of the U.S. Dollar Index (DXY). A simple yet eye-opening approach that links BTC to the USD more than any other asset.
** Traditional Cycle Theory vs BTC/DXY Divergence/ Convergence Theory **
Traditional theory suggests that Bitcoin’s current Bear Cycle is the 4th one. The 1st was in June – November 2011, 2nd in December 2013 – January 2015, 3rd in December 2017 – December 2018 and 4th (current one) in April 2021 – now. However this BTC/DXY Divergence/ Convergence Theory shows that Bitcoin could only be trading on its 2nd ever Historic Cycle and in fact preparing for the final rally that will complete it (curved arrow).
** DXY hyper rally and BTC Bear Phase **
How’s that so? Well by looking at the DXY (green trend-line on your chart), we see that the hyper rally it has been trading on since May 2021 is identical to that of March 2014 – March 2015. Both started a few weeks after Bitcoin peaked (4) and started a Channel Down correction (Bear Phase) that would find a bottom (5) and prepare for the final rally. When that happened in mid 2015, the DXY had peaked and turned sideways for an extended period of time (almost a year). Bitcoin’s final rally peaked (6) when DXY bottomed.
** The Cycle’s Bullish Megaphone pattern **
But what led to this Bear Phase (4-5) and rally (6)? Well it was a period of volatility on DXY which formed a Bullish Megaphone pattern on Bitcoin. The early phase of the pattern (1-2-3) was accumulation after BTC’s rally peak (6) when DXY had recovered from its April 2011 bottom and traded on high volatility and as this sideways move progressed, BTC gained power. Notice the huge Divergence (Rectangle pattern) where Bitcoin peaked (6) and DXY bottomed that was what paved the way for Bitcoin’s Megaphone. The Convergence happened on Phases 1-2-3.
** This is Bitcoin’s only 2nd Cycle **
As you have noticed, this is the exact same pattern that Bitcoin and DXY haven been trading in since December 2018. The Divergence led to the Convergence of the two and creation of the new Megaphone (1-2-3), which based on the model is just its 2nd Cycle ever. DXY’s hyper rally that started in May 2021 following the crash of March – December 2020 due to the COVID trillion rescue packages, which distorted DXY’s true bottom, gave rise to the April 2021 – now Bear Phase (4-5).
This is where we are today. With the DXY on a 1 year hyper rally, which has most likely reached its top as its identical March 2014 – March 2015 rally was completed in one year. If that’s the case, then Bitcoin’s Bear Phase has also bottomed and as discussed at the start of the analysis, it is entering the short accumulation phase that will initiate the final rally outside of the Bullish Megaphone, which validates being its only 2nd Historic Cycle.
But what do you think? Do you agree with the BTC/DXY Divergence/ Convergence Model indicating that we are only on Bitcoin’s second every Cycle? And if so are we about to see the DXY turning sideways and a mega rally on Bitcoin? Feel free to share your work and let me know in the comments section below!
P.S. Because this chart has two assets together, it may appear distorted based on your screen’s/ browser dimensions. The original looks like this below, so if yours doesn’t, adjust the vertical axis in order to make it look like this and better understand what is illustrated:

