

-
WTI OIL Trading Plan
- November 22, 2020
- Posted by: Tradingshot Articles
- Category: Commodities
No Comments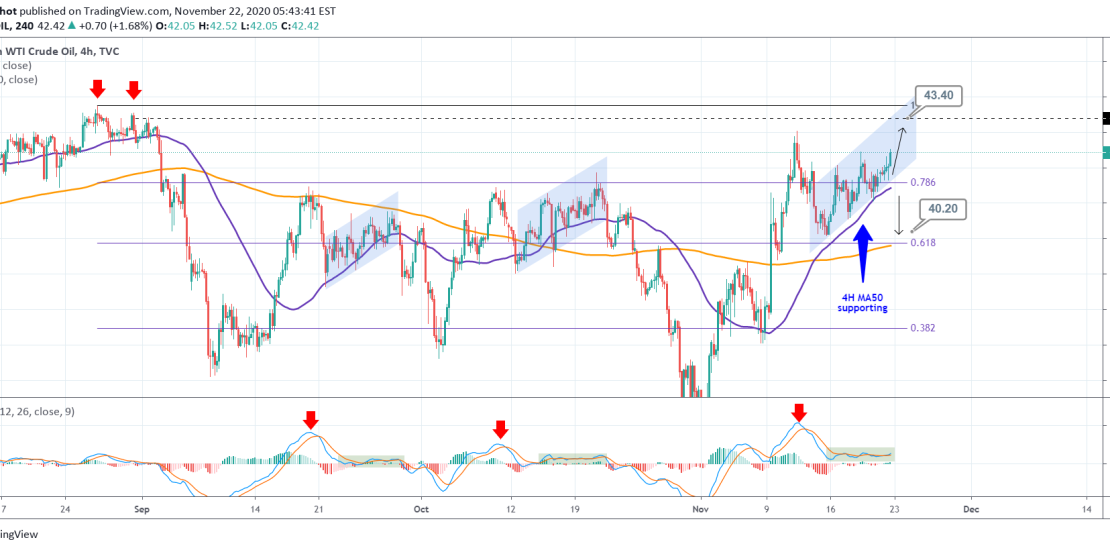
Pattern: Channel Up on 4H. Signal: (A) Buy as long as the 4H MA50 is supporting, (B) Sell if it breaks. Target: (A) 43.40 (September 01 High), (B) 40.20 (just above the 4H MA200). ** Please support this idea with your likes and comments, it is the best way to keep it relevant and
-
WTI OIL high chances to break its bearish channel
- November 9, 2020
- Posted by: Tradingshot Articles
- Category: Commodities
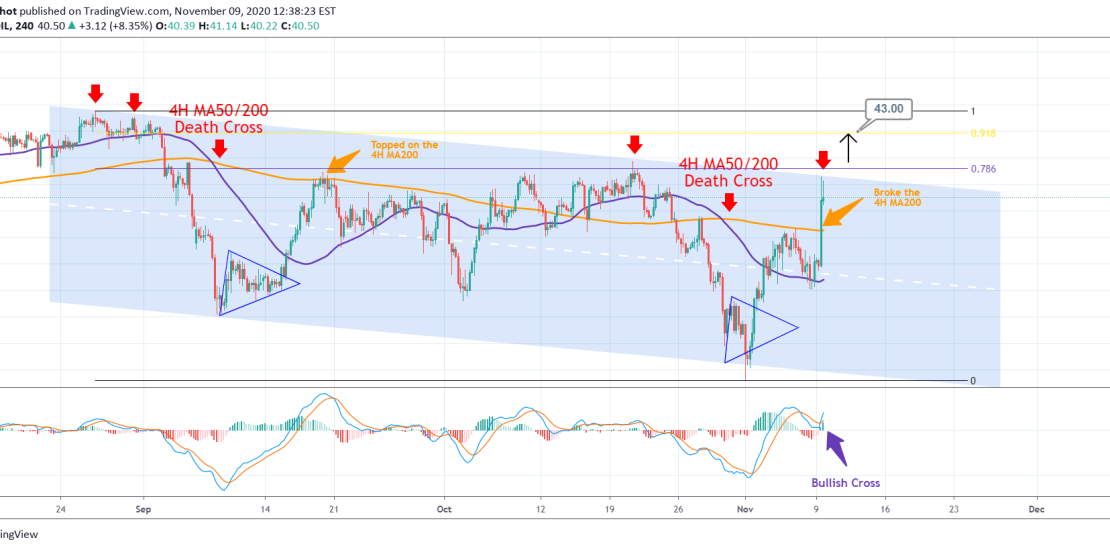
Pattern: Channel Down on 4H. Signal: Buy if the Lower Highs trend-line of the Channel Down breaks (practically if the 0.786 Fib breaks), as this time the price broke the 4H MA200 (as opposed to September 18) while the MACD is on a Bullish Cross. Target: 43.00 (the 0.918 Fib, last Resistance before a
-
WTI OIL Buy Signal
- October 30, 2020
- Posted by: Tradingshot Articles
- Category: Commodities
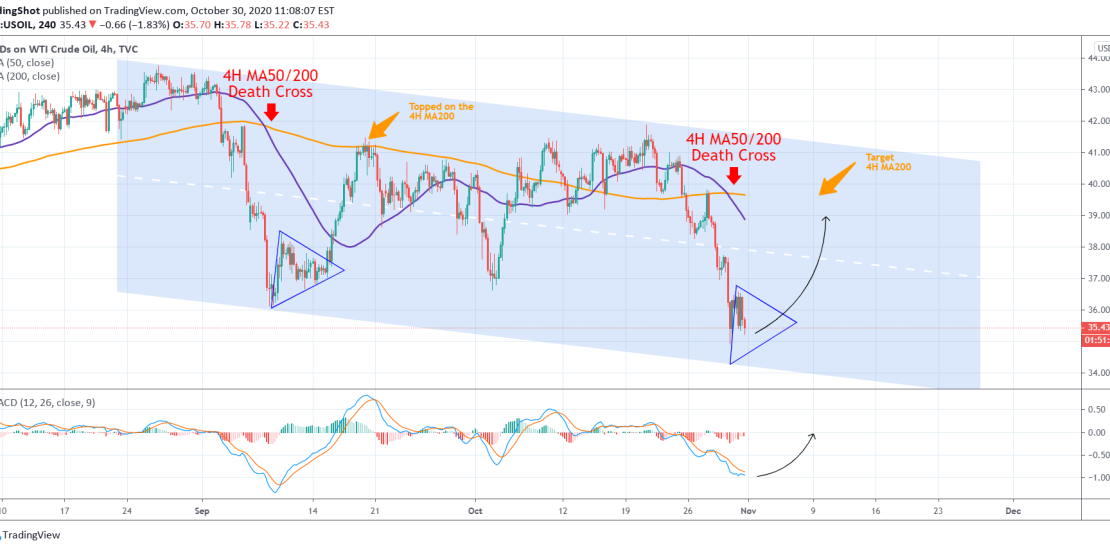
Pattern: Channel Down on 4H. Signal: Buy as the current bearish leg is forming a sequence similar to the September 01 – 14 leg = Death Cross, followed by a Triangle bottom. The signal is invalidated if the Channel breaks the Lower Low trend-line. Target: The 4H MA200. Please like, subscribe and share your
-
OIL Trading Plan
- October 22, 2020
- Posted by: Tradingshot Articles
- Category: Commodities
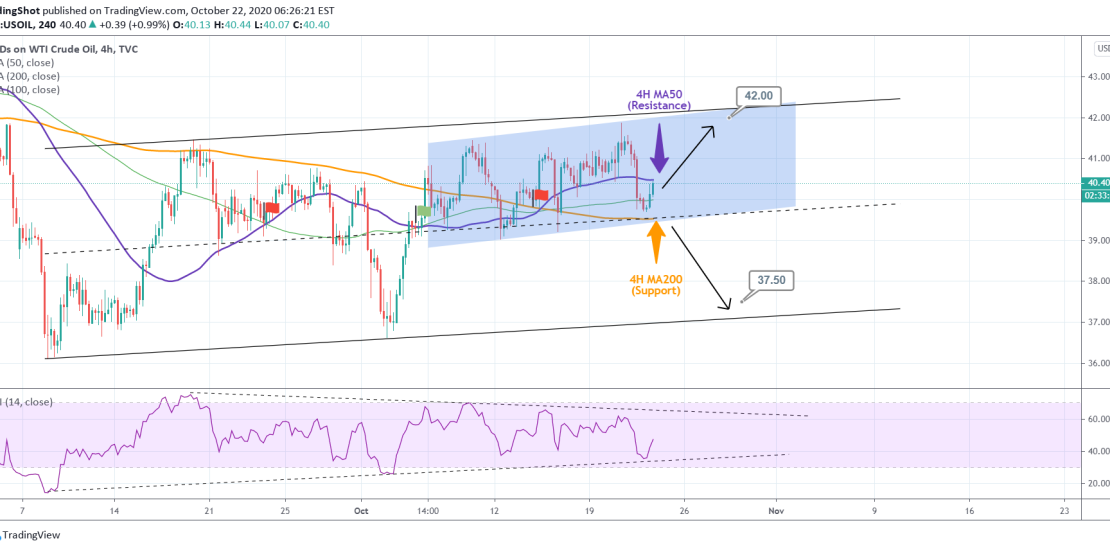
Pattern: Channel Up on 4H (inner/ blue and outer/ black lines). Signal: (A) Buy as long as the 4H MA200 is holding, (B) Sell if the 4H MA200 breaks. Target: (A) 42.00 (just under the Higher High trend-lines of both Channels), (B) 37.50 (just above the Higher Low trend-line of the inner (blue) Channel
-
Will October be Déjà vu for NATURAL GAS?
- October 12, 2020
- Posted by: Tradingshot Articles
- Category: Commodities
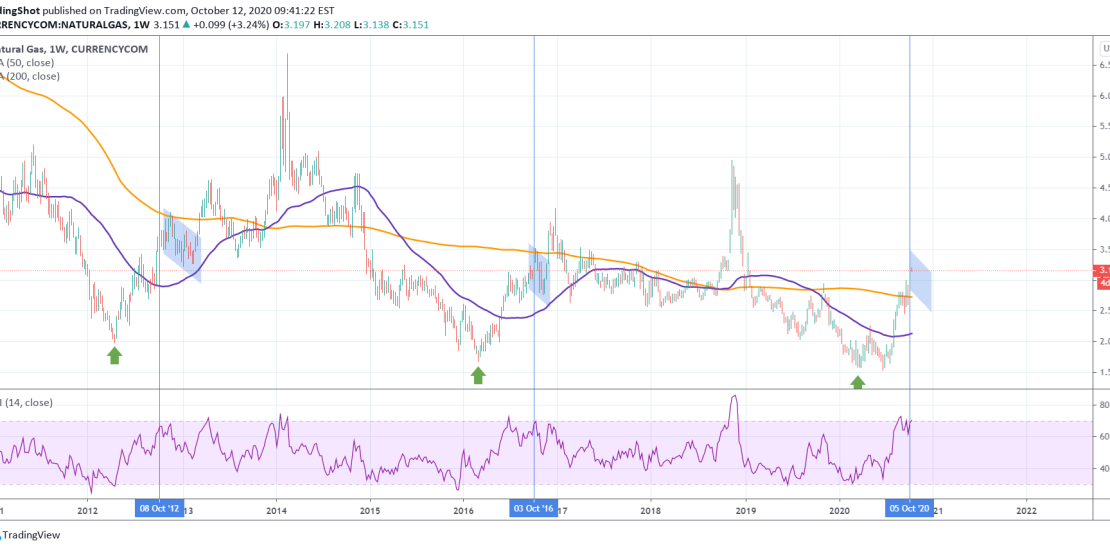
Quick observation here. NG traders that are deep into the commodity’s technical dynamics agree that Natural Gas is trading on patterns that are cyclical on the very long-term. If cyclical behavior and seasonality play a big part on this, then why should the month of October be any different? Every 4 years since 2012,
-
GOLD Will this be the longest Bull Cycle in history?
- October 9, 2020
- Posted by: Tradingshot Articles
- Category: Commodities
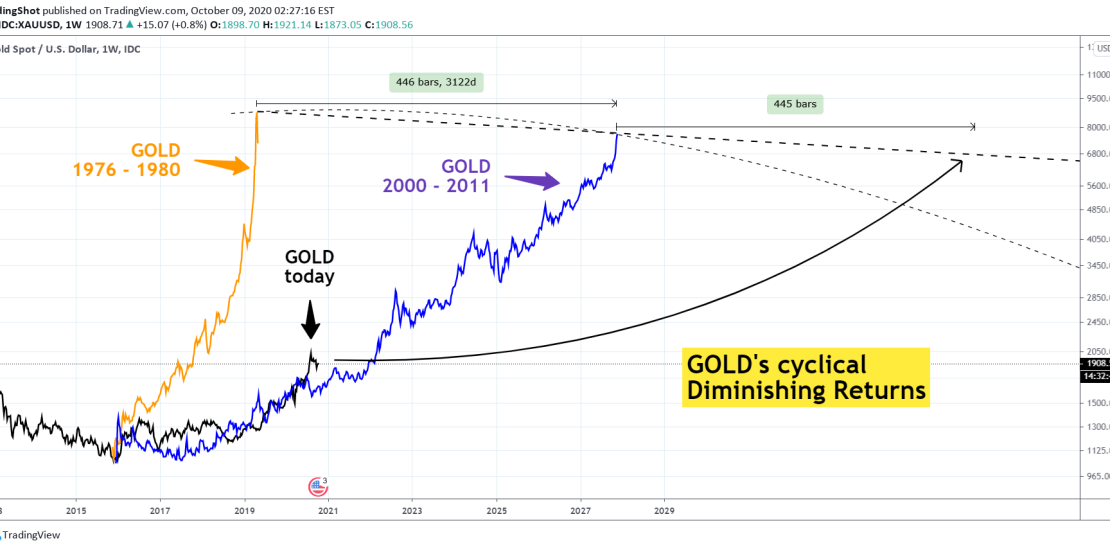
Gold has started a new Bull Cycle (since the late 2015 bottom) that was confirmed after it broke above the $1380 5-year Resistance in mid 2019. The U.S.-China trade war peaking at that time and recently the massive money stimulus from the Federal Reserve creating inflation , Gold has already reached new All Time
-
WTI OIL Buy Signal
- October 5, 2020
- Posted by: Tradingshot Articles
- Category: Commodities
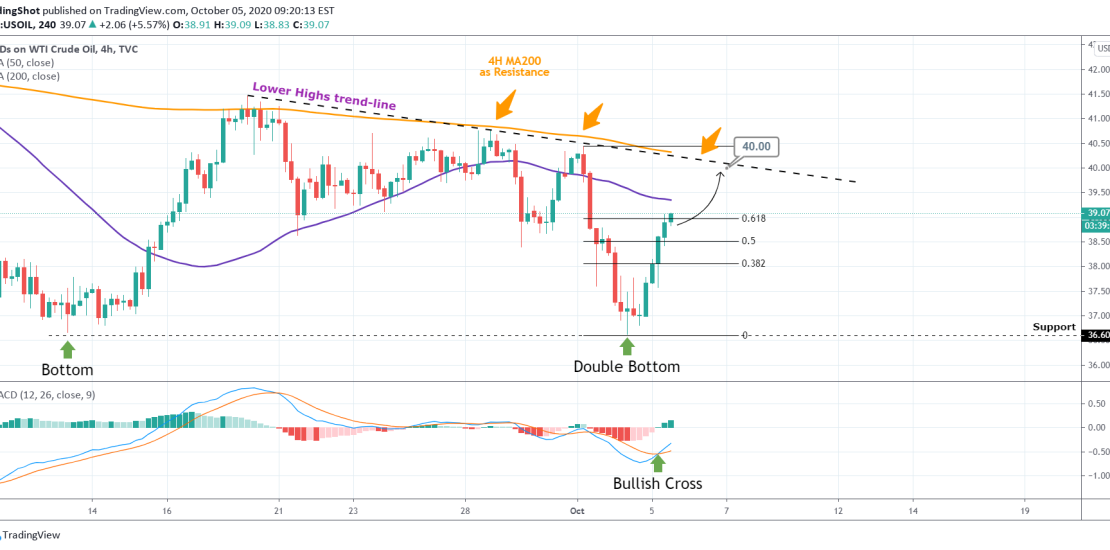
Pattern: Descending Triangle on 4H. Signal: Buy as the price rebounded on the Support making a Double Bottom event, while the MACD made a Bullish Cross. Target: 40 (right on the Lower High trend-line and the 4H MA200). ** Please support this idea with your likes and comments, it is the best way to
-
NATURAL GAS Trading Plan
- September 17, 2020
- Posted by: Tradingshot Articles
- Category: Commodities
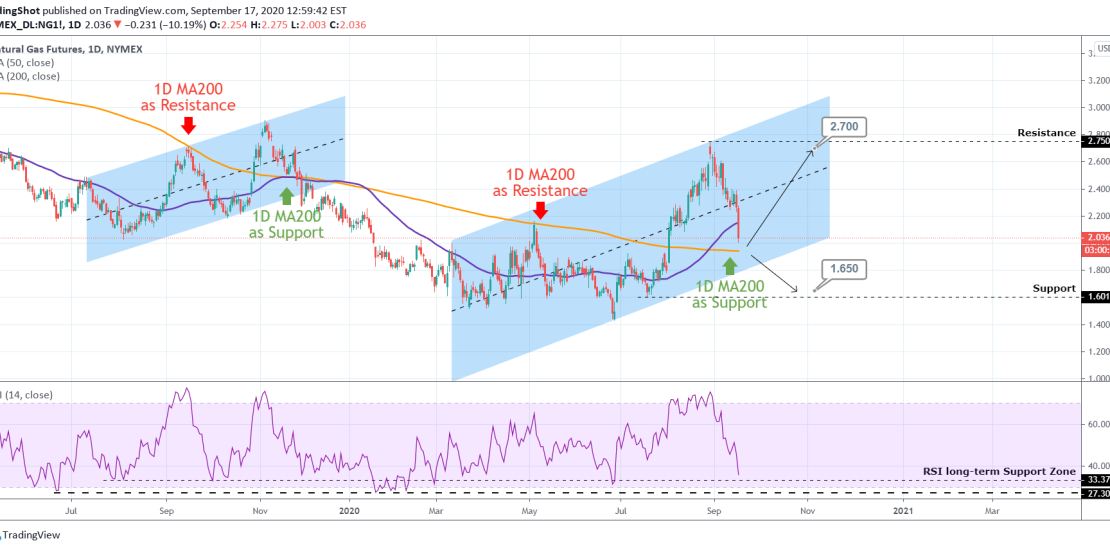
Pattern: Channel Up on 1D. Signal: (A) Buy as long as he price trades above the 1D MA200 (orange line) (B) Sell if it breaks below it. Target: (A) 2.700 (right below the Resistance) (B) 1.650 (right above the Support). *Note: the RSI is near its 1 year Support Zone. Only once this failed
-
Is Gold about to outperform Silver again for years?
- September 3, 2020
- Posted by: Tradingshot Articles
- Category: Commodities
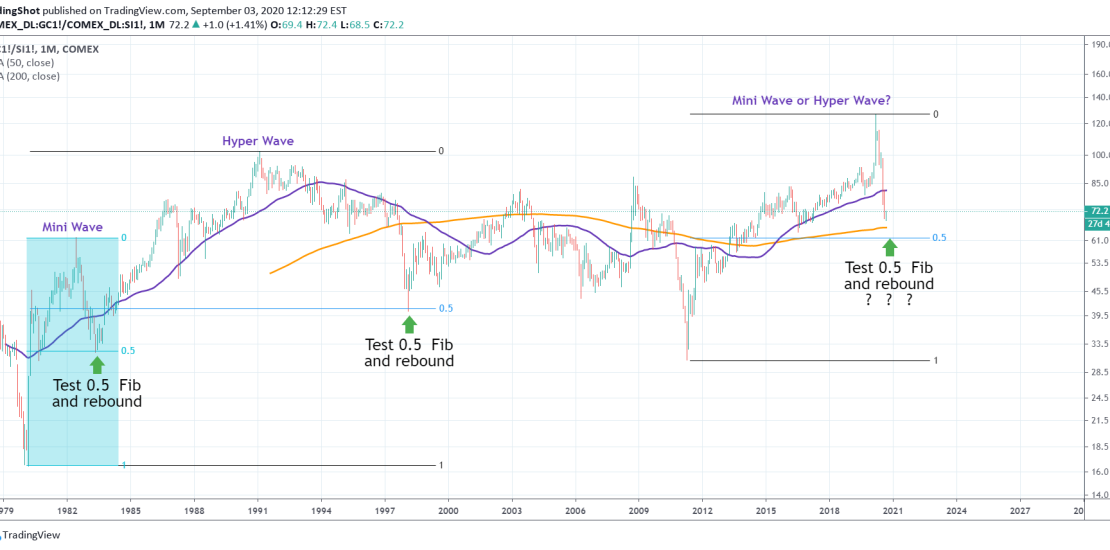
Another simple study of mine looking at the pressure point of the Gold/ Silver ratio. As you see since 1980s, every time GC/SI reaches the 0.5 Fibonacci retracement level, whether it is on a mini wave or hyper wave, the price rebounds strongly and for many years. If the current wave is mini or
-
XAUUSD Trading Plan
- August 7, 2020
- Posted by: Tradingshot Articles
- Category: Commodities
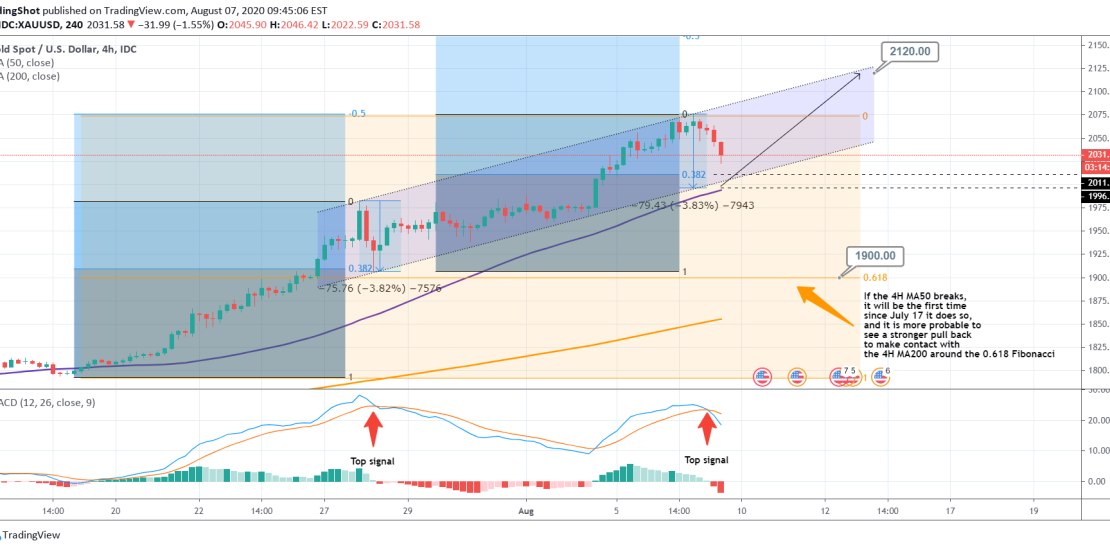
Pattern: Channel Up on 4H. Signal: (A) Buy within the 0.382 Fibonacci and -3.80% from the top, (B) Sell if the 4H MA50 breaks (it will be the first time since July 17). Target: (A) 2120 (Higher High on the Channel below the -0.50 Fib), (B) 1900 (projected contact with the 4H MA200). **