

- October 9, 2020
- Posted by: Tradingshot Articles
- Category: Commodities
The recent 2 month pull-back shouldn’t worry long-term investors. We have entered a new era in money supply and this alone can be enough to sustain this new Bull Cycle to extreme Highs.
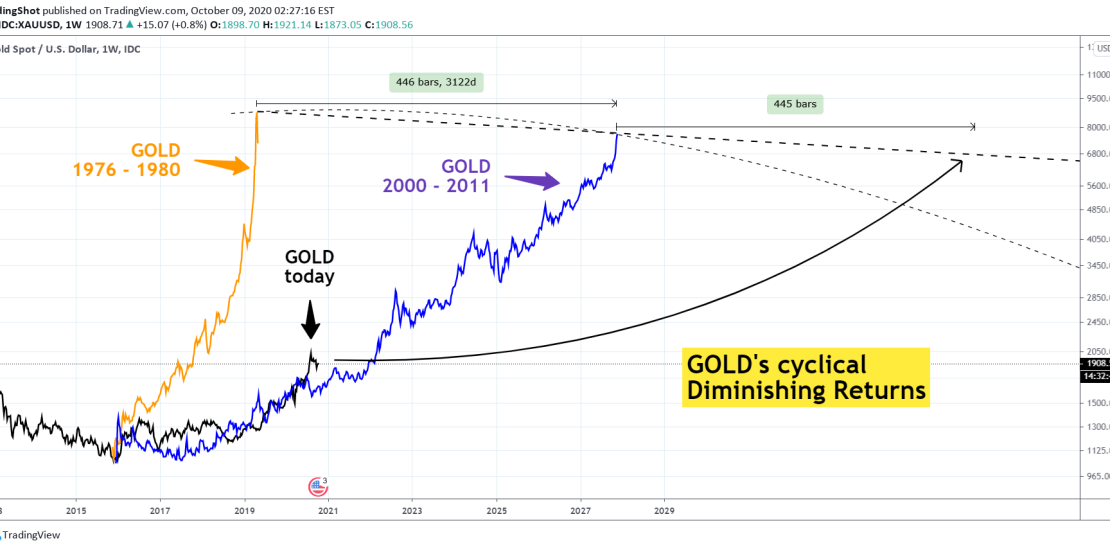
On this chart, I plotted the previous two Bull Cycles (1976 – 1980 and 2000 – 2011) on the current one. We see that the first one (1976 – 1980) was far more aggressive, reaching higher (marginally) but being shorter (considerably) than the second (2000 – 2011). The current Cycle (2015 – now) seems so far to be like the second and if it wasn’t for the U.S. – China tensions and now the massive COVID stimulus, it would have been even less aggressive. As soon as new balances are found, we can argue that this Cycle too might reach (marginally) lower Highs than the previous too, while being longer. Of course it doesn’t have to be symmetrical as my projection shows but that serves as a good illustration to make my point reach out.
That is the “Theory of Diminishing Returns” on economic asset classes that rise through time, and is the same as the one I have published on Bitcoin a few years back. That theory suggests that no matter how strongly an asset rises through time, every time will be less aggressive than the previous one.
Do you agree with this? Feel free to share your work and let me know in the comments section!
Please like, subscribe and share your ideas and charts with the community!
——————————————————————————————————–
!! Donations via TradingView coins also help me a great deal at posting more free trading content and signals here !!
🎉 👍 Shout-out to TradingShot’s 💰 top TradingView Coin donor 💰 this week ==> zSplit
——————————————————————————————————–
P.S. For those who recognize the analysis, this is a repost of the idea below which I published on September 27 and got deleted. I am publishing it again in order to be used for future reference reasons:
