

-
GOLD/SILVER ratio in the Subprime and COVID crises
- June 24, 2020
- Posted by: Tradingshot Articles
- Category: Commodities
No Comments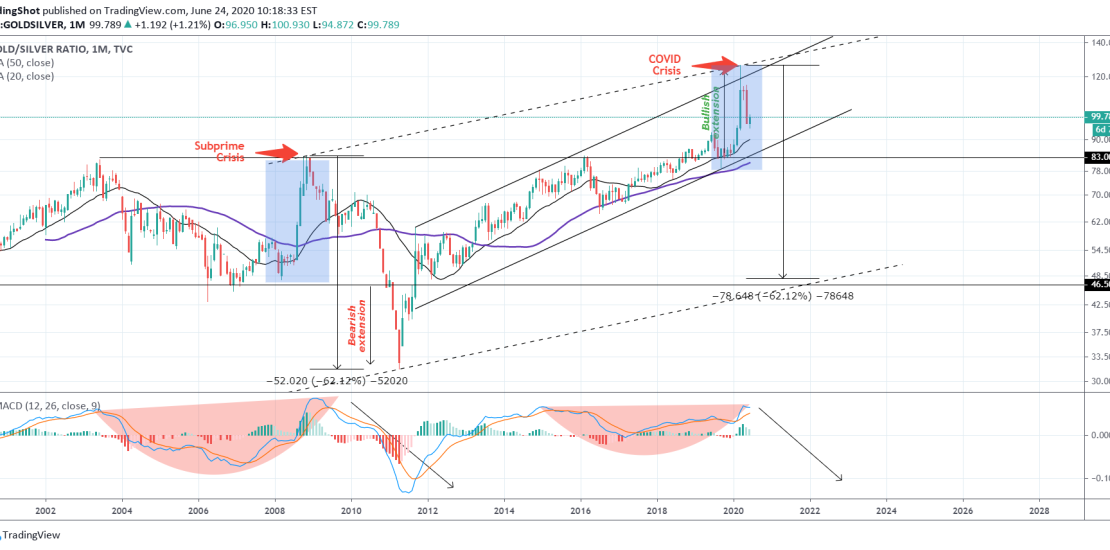
I don’t know how many of you speculate on the Gold/ Silver ratio but I do. And I have come across an interesting pattern in 2008 during the Subprime Mortgage Crises that may be repeated now during the COVID crisis. As you see on the chart, the LMACD is the key indicator on it,
-
XAUUSD Trading plan
- June 18, 2020
- Posted by: Tradingshot Articles
- Category: Commodities
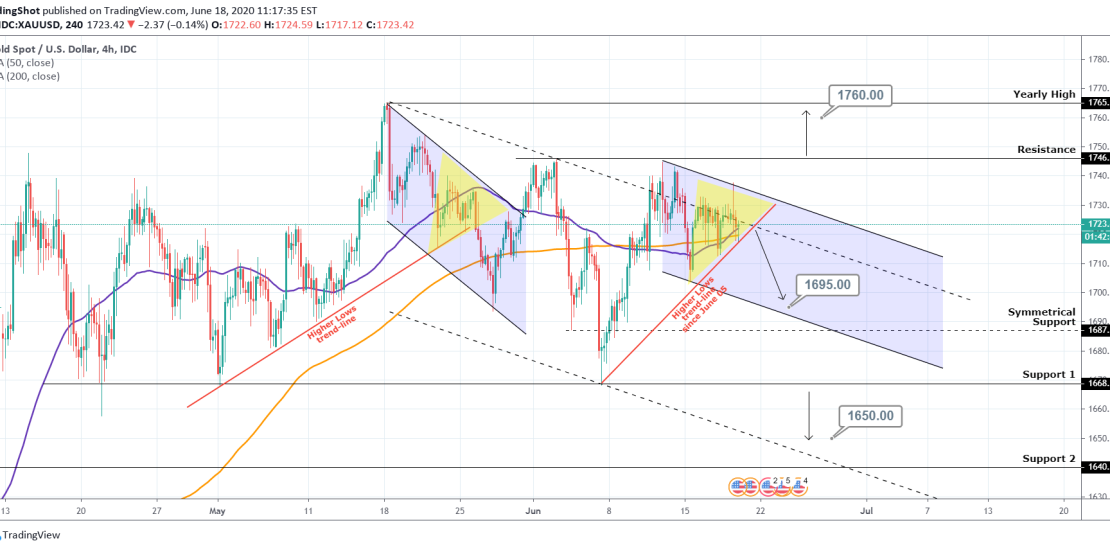
Pattern: Channel Down on 4H. Signal: (A) Bearish is the (red) Higher Lows trend-line breaks. Bearish extension below Support 1. (B) Bullish if the 1746 Resistance breaks. Target: (A) 1695 (Lower Low of the Channel Down), (B) 1760 (just below the Yearly High). ** Please support this idea with your likes and comments, it
-
WTI OIL Trading plan
- June 18, 2020
- Posted by: Tradingshot Articles
- Category: Commodities
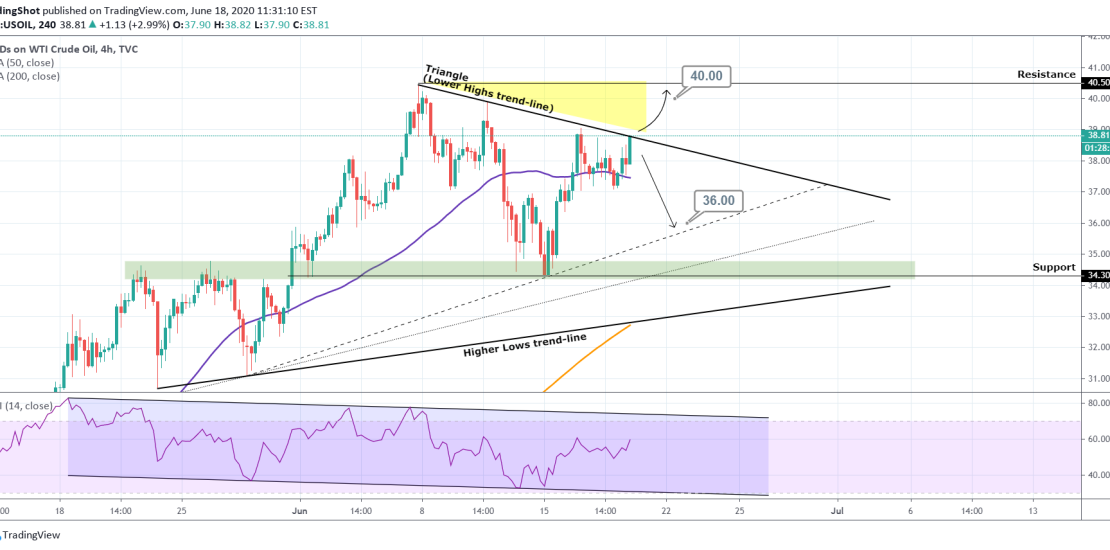
Pattern: Triangle on 4H. Signal: (A) Bullish if the Lower Highs trend-line breaks, (B) Bearish if it gets rejected. Target: (A) 40.00 (just below the Resistance), (B) 36.00 (the first inner Higher Lows trend-line). ** Please support this idea with your likes and comments, it is the best way to keep it relevant and
-
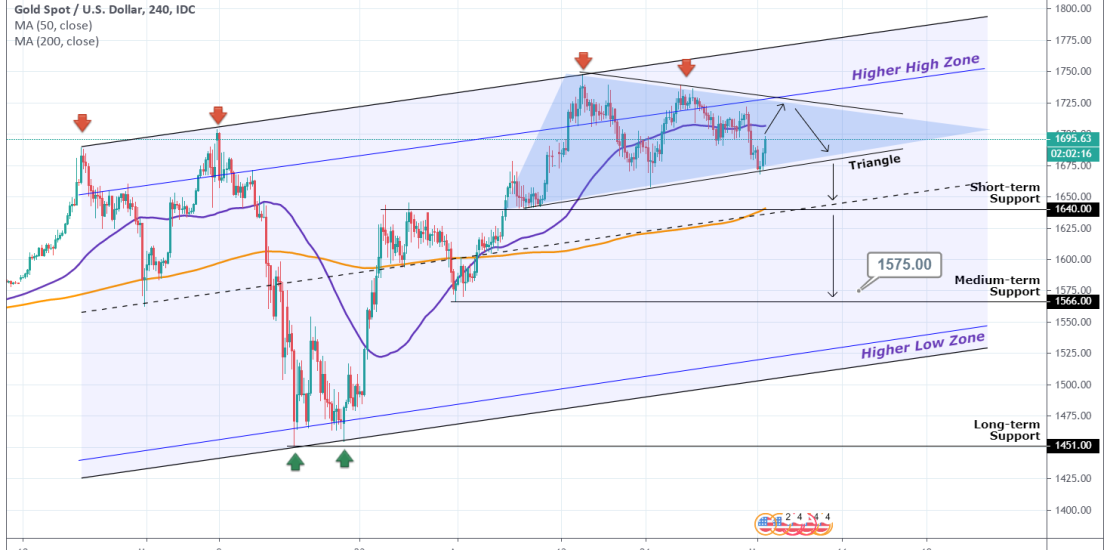
XAUUSD Sell Signal
- May 20, 2020
- Posted by: Tradingshot Articles
- Category: Commodities
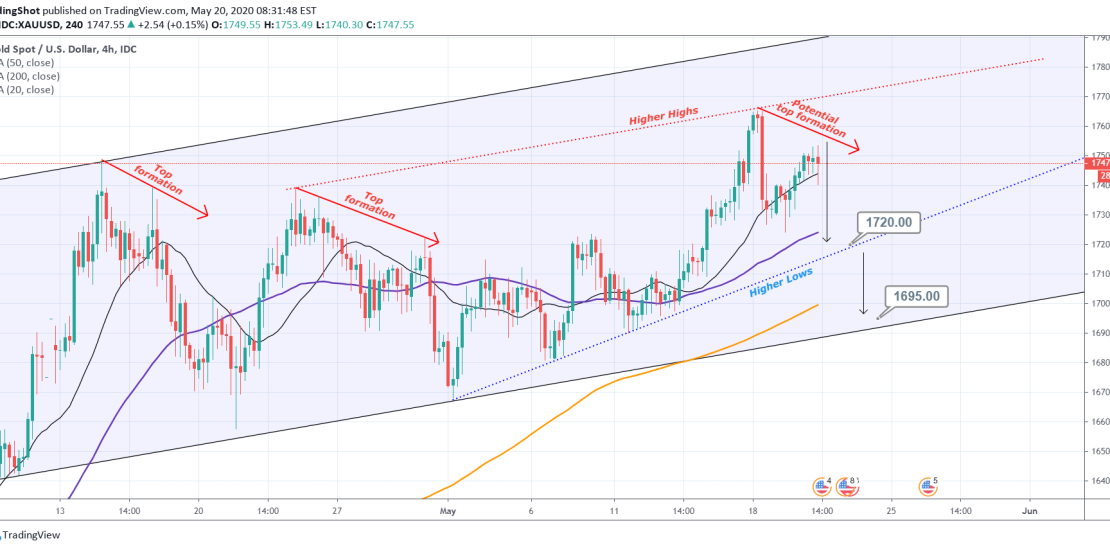
Pattern: Channel Up on 4H. Signal: Bearish as the pattern was rejected on the Higher High zone of the pattern and is on a potential top formation. Target: 1720 short-term (just above the Higher Lows) and 1695 medium-term with higher risk if the blue dotted line breaks. ** Please support this idea with your
-
Is GOLD preparing a +7% rise?
- May 14, 2020
- Posted by: Tradingshot Articles
- Category: Commodities
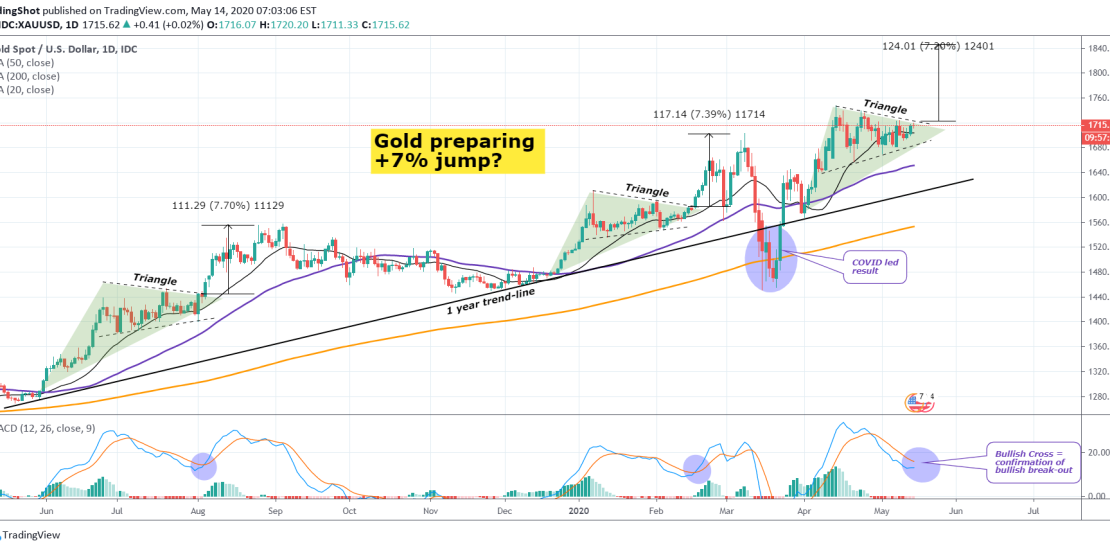
This is based on the long-term trend starting 1 year ago (exactly May 2019). I want your opinion on this very interesting pattern I found. As you see and probably most are well aware of, Gold has been trading within a Triangle since early April on the 1D chart, with the MACD
-
XAUUSD How to trade the Triangle.
- May 1, 2020
- Posted by: Tradingshot Articles
- Category: Commodities
Pattern: Triangle on 4H. Signal: Bearish if it breaks downwards. Ideal entry just over the 4H MA50. Target: 1,640 (short term Support) and 1,575 (medium term Support) in extension. Tradingview link: https://www.tradingview.com/chart/XAUUSD/3UehJTVp-XAUUSD-How-to-trade-the-Triangle
-
XAUUSD Daily trading plan
- April 8, 2020
- Posted by: Tradingshot Articles
- Category: Commodities
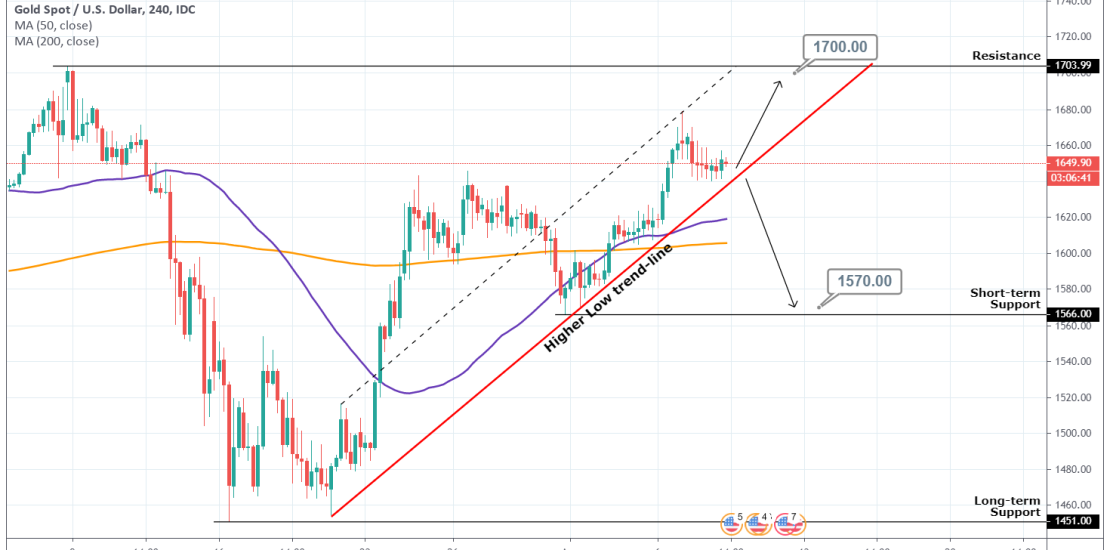
Pattern: Higher Low sequence on 4H. Signal: (A) Bullish as long as the Higher Low trend-line (red) holds, (B) Bearish if it breaks. Target: (A) $1700 (Just below the Resistance), (B) 1,570 (just above the short-term Support). Tradingview link: https://www.tradingview.com/chart/XAUUSD/ErxDI1zA-XAUUSD-Daily-trading-plan
-
USOIL Buy Signal
- March 31, 2020
- Posted by: Tradingshot Articles
- Category: Commodities
Pattern: Fibonacci retracement Signal: Bullish as the price made a bullish cross on the MACD and the whole pattern is similar to the previous sequence that topped on the 0.618 Fibonacci. Target: 22.80 (just below the 0.618 Fibonacci retracement). Tradingview link: https://www.tradingview.com/chart/USOIL/tukiDrS0-USOIL-Buy-Signal
-
XAUUSD Sell Signal
- March 11, 2020
- Posted by: Tradingshot Articles
- Category: Commodities
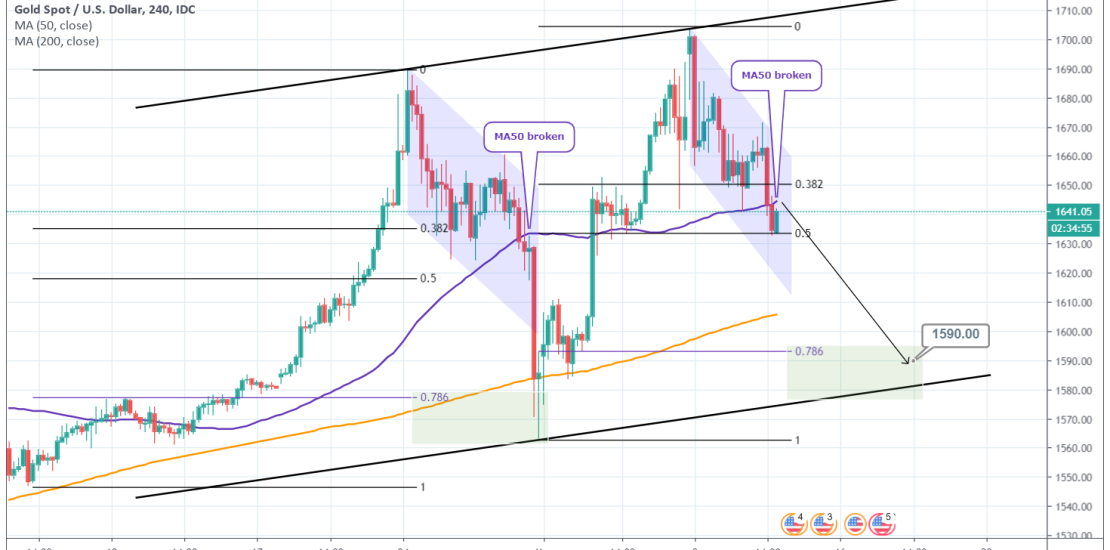
Pattern: Channel Down on 4H. Signal: Bearish as the 4H MA50 broke and that was a bearish signal last time it took place. Target: 1590 (the 0.786 Fibonacci retracement). Tradingview link: https://www.tradingview.com/chart/XAUUSD/qZz02FeU-XAUUSD-Sell-Signal
-
XAUUSD: Sell Signal
- March 5, 2020
- Posted by: Tradingshot Articles
- Category: Commodities
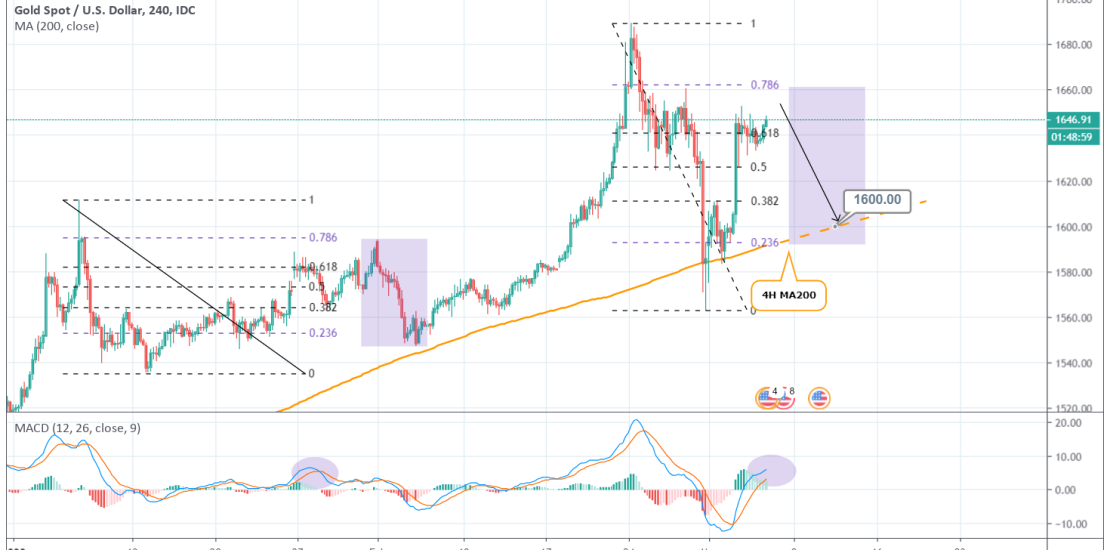
Pattern: 0.618 Fibonacci retracement on 4H. Signal: Bearish as the pattern appears to be repeating the similar January retracement sequence. Target: 1600 (expected contact with the 4H MA200). Previous Sell Signal: Tradingview link: https://www.tradingview.com/chart/XAUUSD/bwf6OeqF-XAUUSD-Sell-Signal