- October 12, 2020
- Posted by: Tradingshot Articles
- Category: Commodities

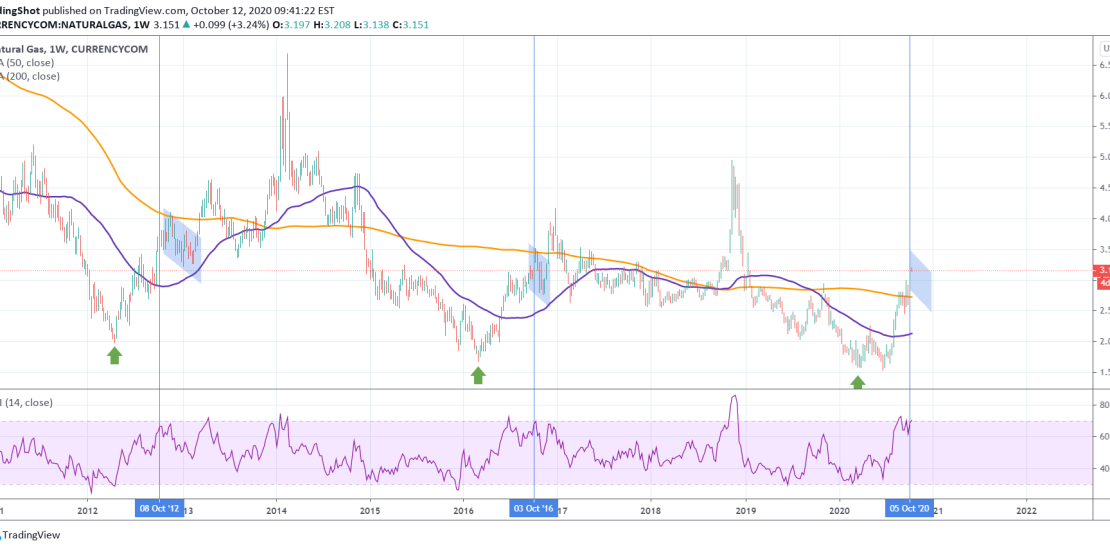
Quick observation here. NG traders that are deep into the commodity’s technical dynamics agree that Natural Gas is trading on patterns that are cyclical on the very long-term.
If cyclical behavior and seasonality play a big part on this, then why should the month of October be any different? Every 4 years since 2012, NG makes a bottom around March-April, then rises aggressively up until October, which initiates a pull-back. That pull-back appears to be a Bull Flag for a new High a few months later.
Will history repeat itself?
** Please support this idea with your likes and comments, it is the best way to keep it relevant and support me. **
——————————————————————————————————–
!! Donations via TradingView coins also help me a great deal at posting more free trading content and signals here !!
🎉 👍 Shout-out to TradingShot’s 💰 top TradingView Coin donor 💰 this week ==> AxelShadah
——————————————————————————————————–
Tradingview link:

