
-
FTSE 2017 fractal points to a 7500 top
- August 12, 2021
- Posted by: Tradingshot Articles
- Category: Stock Indices
No Comments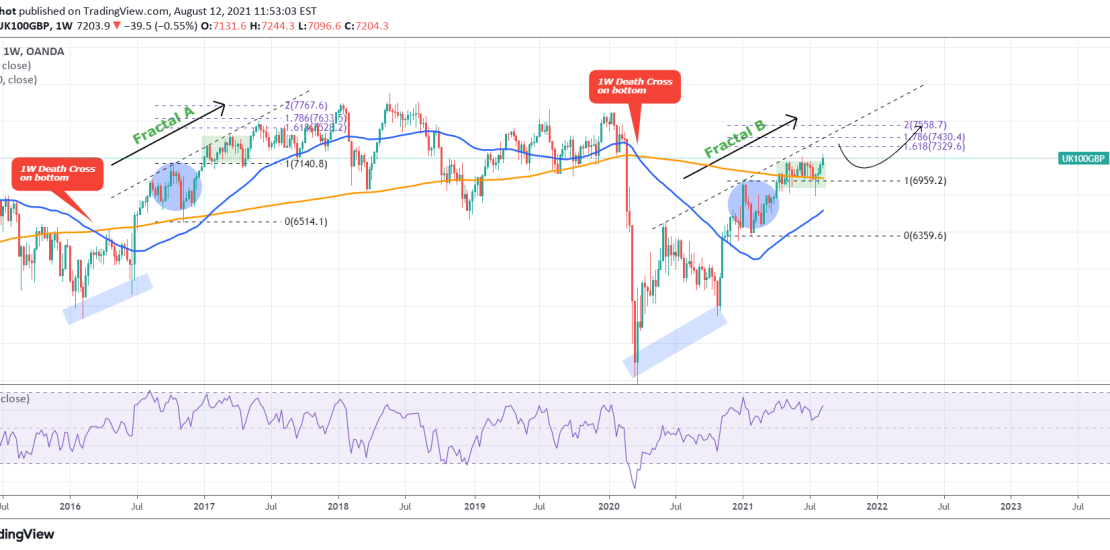
This is a fractal analysis on FTSE from 2017. Not much description is needed here, the chart is quite straightforward. The 2020-2021 (Fractal B) price action so far is similar to the 2016-2017 (Fractal A) sequence. They both started after the market bottomed out on a 1W Death Cross and have been rising with
-
EURUSD hit the 4H Lower Lows trend-line
- August 11, 2021
- Posted by: Tradingshot Articles
- Category: Forex
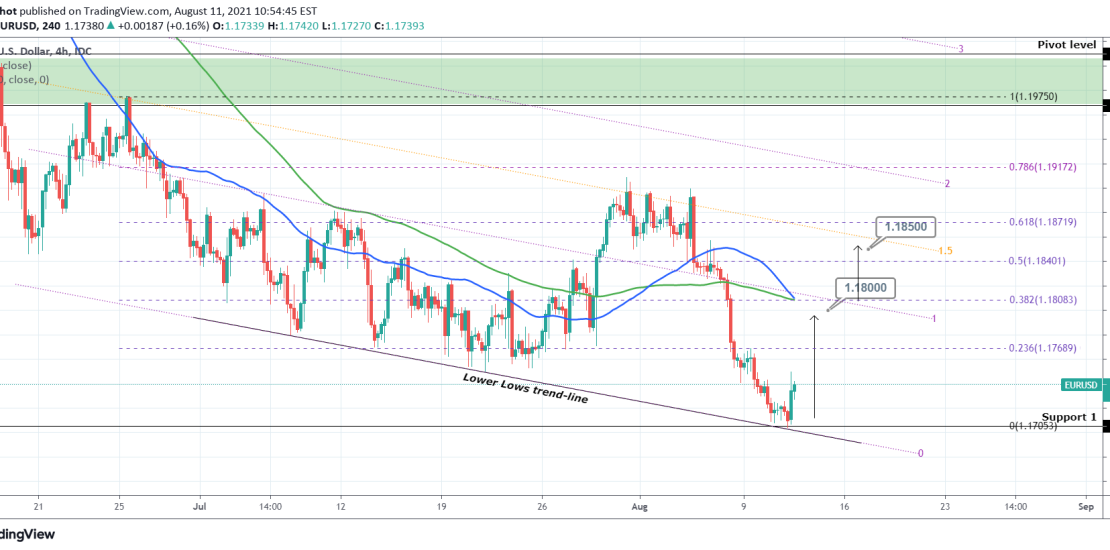
Pattern: Bearish Fibonacci Channel on 4H. Signal: Buy as the price hit the Lower Lows trend-line of the Channel which within July has always initiated a rebound towards at least the 4H MA50 (blue trend-line). Target: 1.1800 short-term (right below the Channel’s 1.0 Fib and the horizontal 0.382 Fib retracement) and 1.18500 medium-term (right
-
XAUUSD Bullish divergence and Inverse H&S lead to break-out
- August 11, 2021
- Posted by: Tradingshot Articles
- Category: Commodities
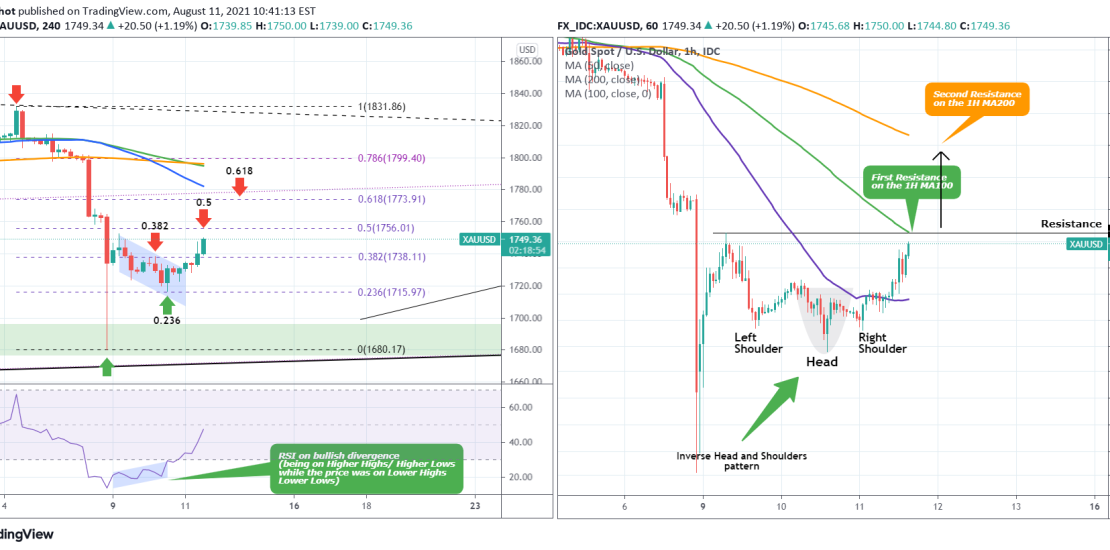
This is a short-term update to my recent long-term idea: As you see on the left chart, Gold broke above the Channel Down and the early signal to this break-out was the 4H RSI which was you see was on a Bullish Divergence as while the price was in a Channel Down, the RSI
-
XAGUSD Multi-decade Cup & Handle?
- August 9, 2021
- Posted by: Tradingshot Articles
- Category: Commodities
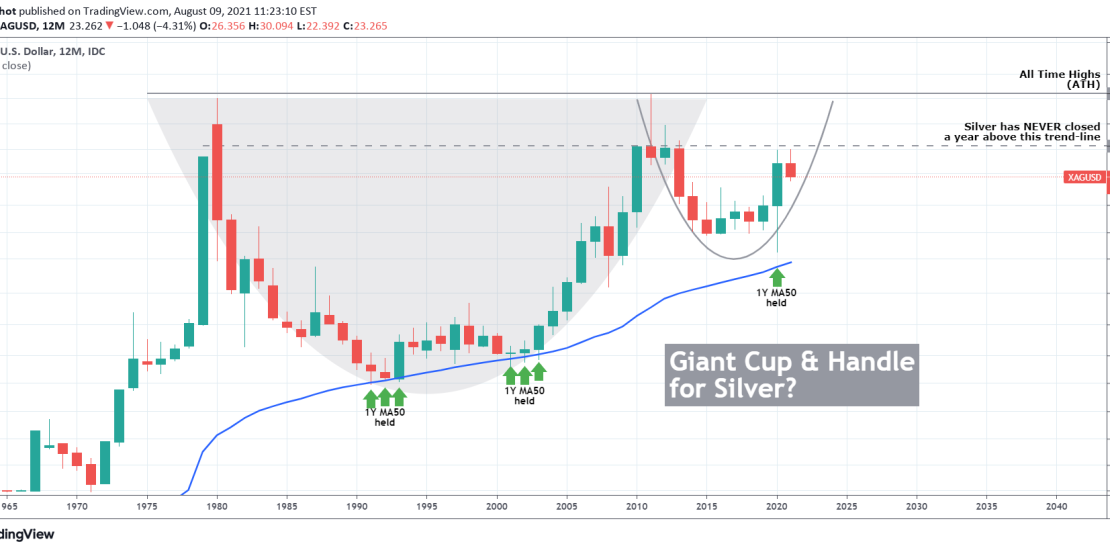
Silver pulled back on Friday and today along with most major commodities due to the USD showing strength on the incredible Nonfarm Payrolls numbers. All this short-term price action though can be viewed as nothing but noise on one pattern that has been developing since 1980 and may be close to completion. I am
-
XAUUSD is approaching the 2018 bullish trend-line.
- August 9, 2021
- Posted by: Tradingshot Articles
- Category: Commodities
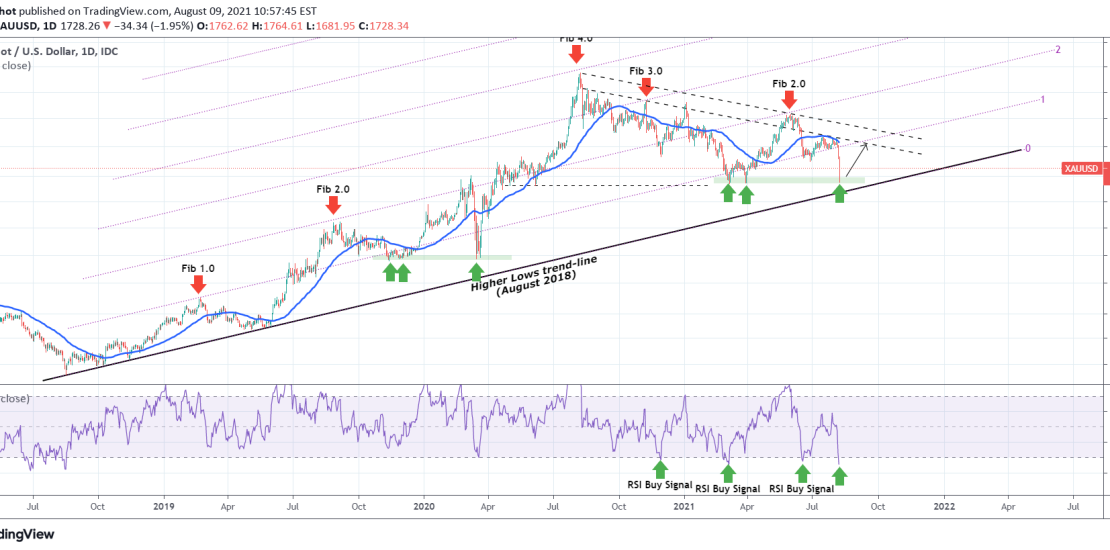
The Nonfarm Payrolls (much) better than expected numbers delivered a major blow to Gold last Friday, which was extended today into one of the most violent daily sessions of the past 2 years (along with August 12 2020 and March 16 2020), that reached the March 2021 lows, which currently acts as the Support
-
BITCOIN is testing the 1D MA200, key to continue the Bull Cycle.
- August 7, 2021
- Posted by: Tradingshot Articles
- Category: Cryptocurrency
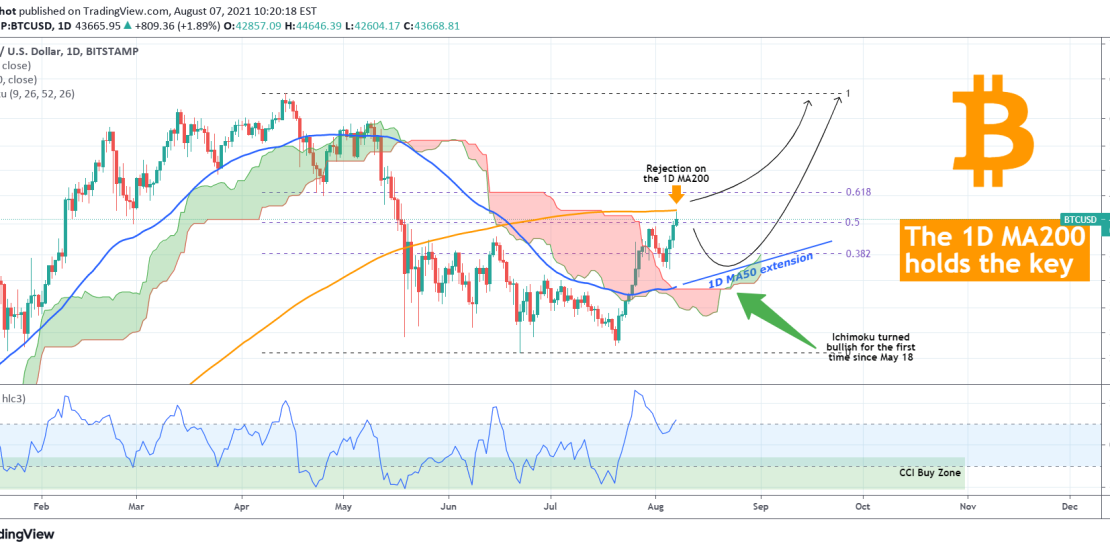
Not that long ago, on July 21, when Bitcoin hit its two month Support Zone of 29000 – 30100 and Triple Bottomed, I posted the following analysis indicating that the Target was the 1D MA200 (orange trend-line): Well today the price finally reached that level after 72 days (first time since May 26), and
-
BITCOIN 2nd straight green week and 1st green month since March!
- August 3, 2021
- Posted by: Tradingshot Articles
- Category: Cryptocurrency
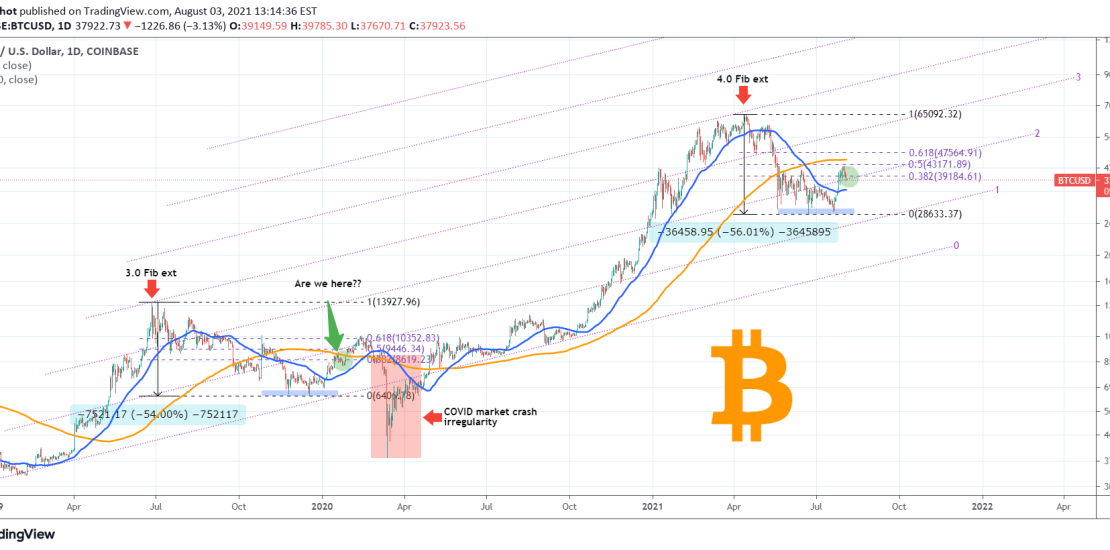
What do the above candle closings on the weekly and monthly time-frames tell us? In my opinion quite a lot of information. The weekly (1W) closing came after holding the 1W MA50 which has been the Support for over 1 year now (since late April 2020) after Bitcoin recovered from the COVID March 2020
-
XAUUSD Sideways until one of those lines breaks
- August 2, 2021
- Posted by: Tradingshot Articles
- Category: Commodities
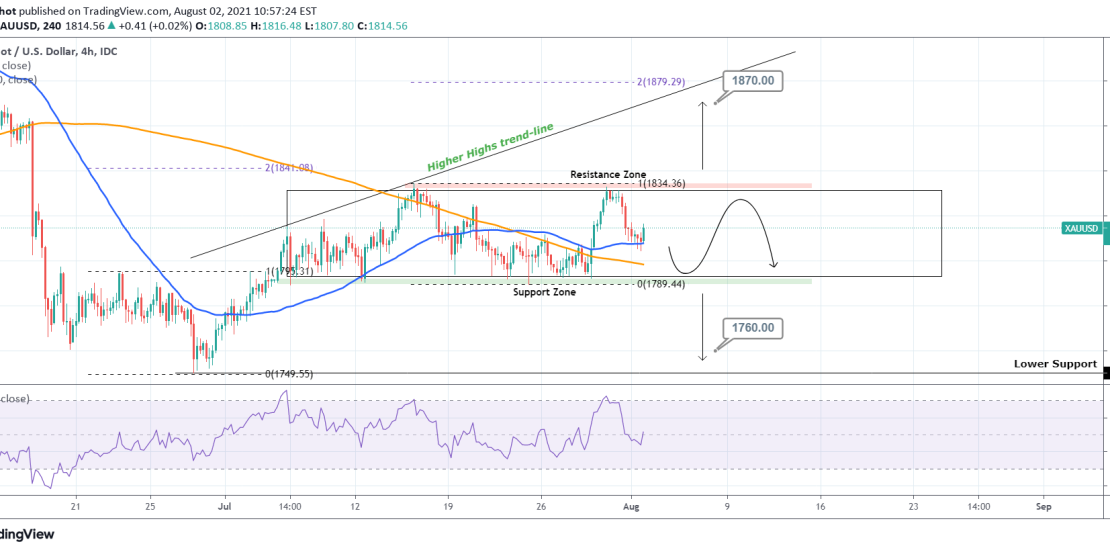
Pattern: Rectangle on 4H. Signal: Scalping as long as the Resistance and Support zones break. (A) Buy if the Resistance breaks, (B) Sell if the Support breaks. Target: (A) 1870 (just below the 2.0 Fibonacci extension), (B) 1760 (just above the 1750 1D Support). Tradingview link: https://www.tradingview.com/chart/XAUUSD/FE4dVAoe-XAUUSD-Sideways-until-one-of-those-lines-breaks
-
BITCOIN Golden Cross fractal potentially point to 49k and 59k
- July 31, 2021
- Posted by: Tradingshot Articles
- Category: Cryptocurrency
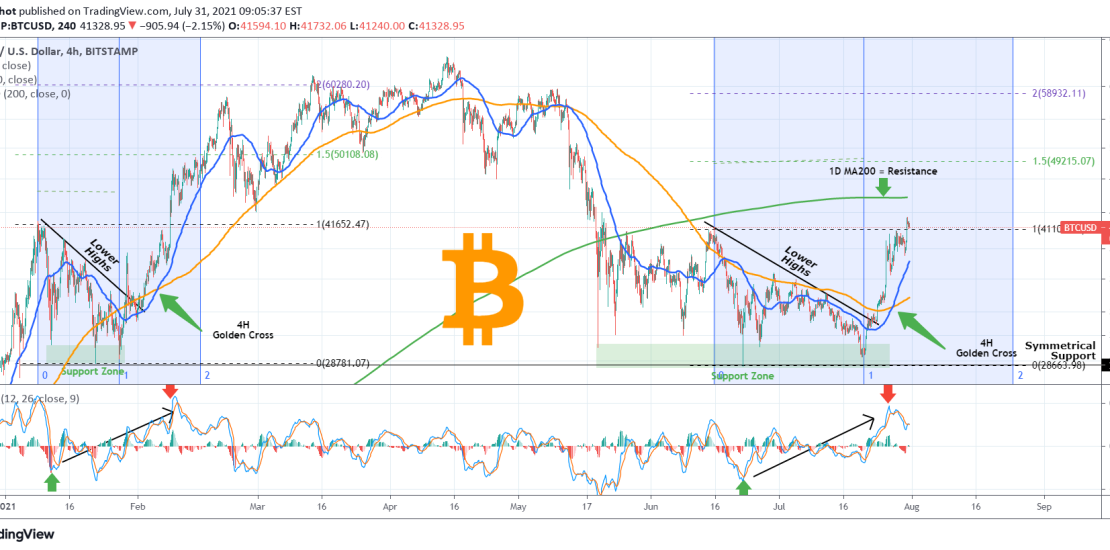
With all of Bitcoin’s aggressive rise last week, a formation that went unnoticed by many was the Golden Cross (when the MA50 crosses above the MA200) on the 4H time-frame. And quite deservedly as the last 4H Golden Cross on June 17 failed to deliver a rise. The current one however managed to overcome
-
GOLD to BITCOIN ratio. Has it bottomed or one last drop?
- July 30, 2021
- Posted by: Tradingshot Articles
- Category: Cryptocurrency
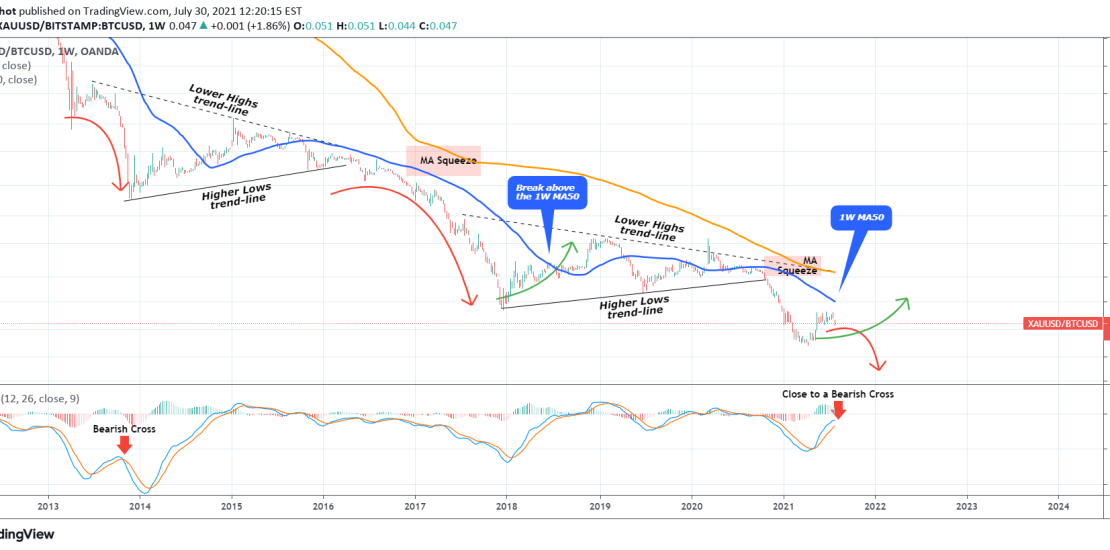
Last time I looked into this very informative ratio was in late October 2020, right before Bitcoin started its new Parabolic Rise: The Triangle broke to the downside and that heavily favored BTC against Gold in a diverging trade trade that few saw. Since April though, we saw BTC giving away power to Gold
