

- July 31, 2021
- Posted by: Tradingshot Articles
- Category: Cryptocurrency
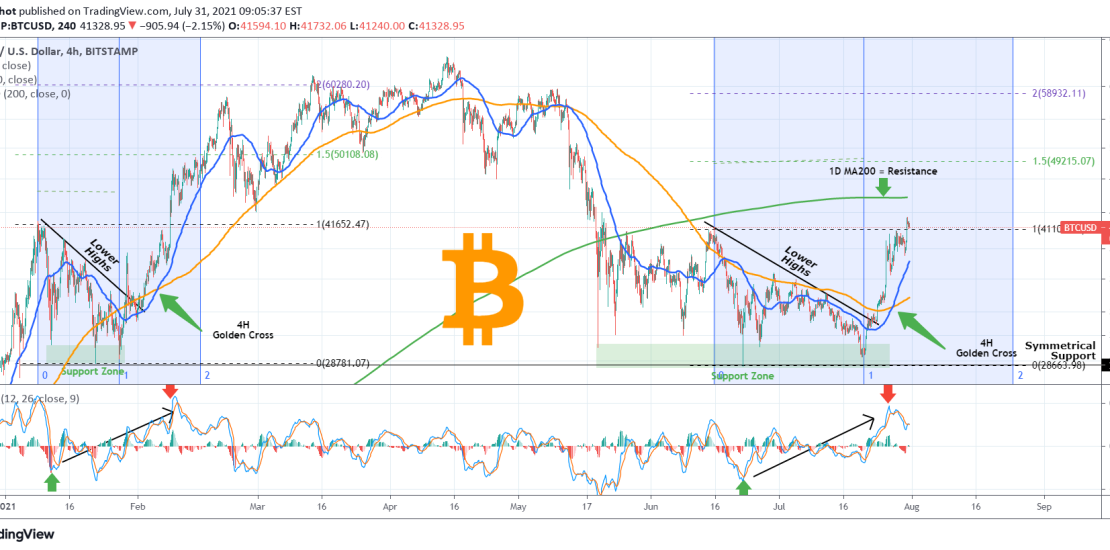
With all of Bitcoin’s aggressive rise last week, a formation that went unnoticed by many was the Golden Cross (when the MA50 crosses above the MA200) on the 4H time-frame. And quite deservedly as the last 4H Golden Cross on June 17 failed to deliver a rise. The current one however managed to overcome the July 27 drop and instead break above the $41000 Resistance.
The last successful 4H Golden Cross was earlier this year, on February 05, a formation that has many similarities with the current one. That fractal (February’s) also broke above its Resistance following the 4H Golden Cross and a peak on the LMACD (shown below) and then moved on for Higher Highs just below the 1.5 Fibonacci extension and 2.0 Fibonacci extension successively.
BTC has proved that symmetry matters as my July 21 post showed below:

As a result it might be useful to look at the two fractals at hand in a similar symmetrical fashion. I have applied the Time Fibonacci Zones on February’s fractal with the start (0) on the January 08 High and the end (1) on the January 27 bottom. That gives a proportionate time extension on February 15 which is when the Higher High just below the 1.5 Fibonacci took place.
If we apply the same Time Fib Zone (start on June 15 and end on July 20) on the current fractal, we get the 2.0 Time Fib on August 24. The 1.5 Fib extension is just over $49000 and the 2.0 just below $59000. Is it realistic to start filling those by the end of August? We’ll see, but we shouldn’t ignore also the gravity of the 1D MA200 (green trend-line on this chart) which has been the Resistance since May 21.
Feel free to share your work and let me know in the comments section!
Tradingview link: