

- August 9, 2021
- Posted by: Tradingshot Articles
- Category: Commodities
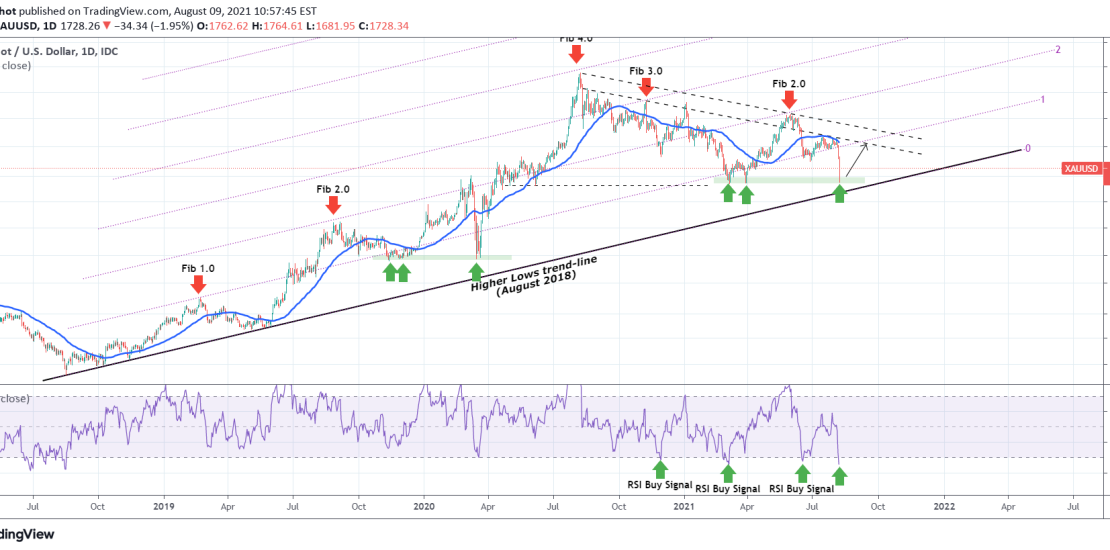
The Nonfarm Payrolls (much) better than expected numbers delivered a major blow to Gold last Friday, which was extended today into one of the most violent daily sessions of the past 2 years (along with August 12 2020 and March 16 2020), that reached the March 2021 lows, which currently acts as the Support Zone. In fact the 1675.50 – 1670 Support Zone has been holding since April 2020, right after Gold recovered from the March 2020 COVID melt-down.
The key point of today’s post though is the fact that the price is now closer than ever to the August 2018 bullish (Higher Lows) trend-line that started Gold’s hyper bull trend. If the Support Zone holds, then it will be a Triple Bottom and one can’t help but to see similarities with the March 2020 one.
Also the 1D RSI just broke the 30.000 level which is where a Buy Signal emerges even in this 12 month down-trend. During the hyper uptrend, the Fibonacci extension played a major role in defining Higher Highs but so do during this 12 month correction. On top of that we see a clear Lower Highs zone (dashed lines). Assuming its a Triple Bottom, then a test of that Lower Highs zone is the most realistic case for buyers until broken. If the Support Zone breaks, investors should start realizing that despite the inflationary pressures, Gold may be entering a new multi-year Bear Cycle.
Tradingview link:
https://www.tradingview.com/chart/XAUUSD/bKoLeAJS-XAUUSD-is-approaching-the-2018-bullish-trend-line