
-
BITCOIN How the VIX will push it (along with stocks) much higher
- April 27, 2023
- Posted by: Tradingshot Articles
- Category: Cryptocurrency
No Comments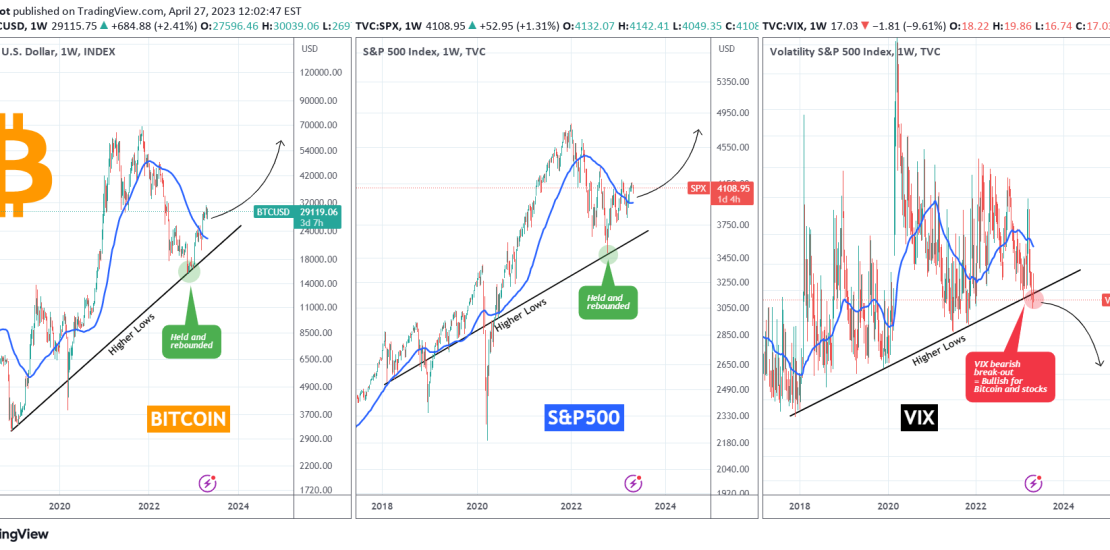
You may be wondering what Bitcoin (BTCUSD) has to do with the S&P500 index (SPX) and the Volatility Index (VIX). Well this chart gives you the answer and sets the tone for the remainder of the year and beyond. As you see Bitcoin (chart on the left) rebounded on the Higher Lows trend-line that started
-
XAUUSD on a breaking point. Get ready for the big move.
- April 27, 2023
- Posted by: Tradingshot Articles
- Category: Commodities
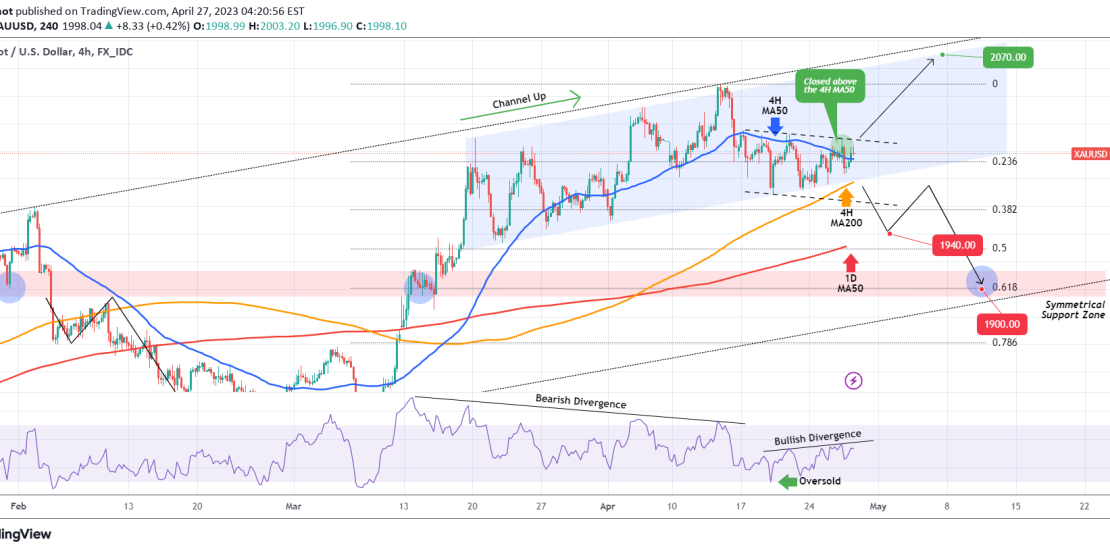
Gold (XAUUSD) closed above the 4H MA50 (blue trend-line) yesterday for the first time since April 14. This is the first major bullish signal in a while but it is not confirmed yet as the price remains and in fact got rejected on the (dashed) Channel Down. A 4H candle close above it will be
-
BITCOIN Held key Cycle Support, preparing a mega break-out!
- April 26, 2023
- Posted by: Tradingshot Articles
- Category: Cryptocurrency
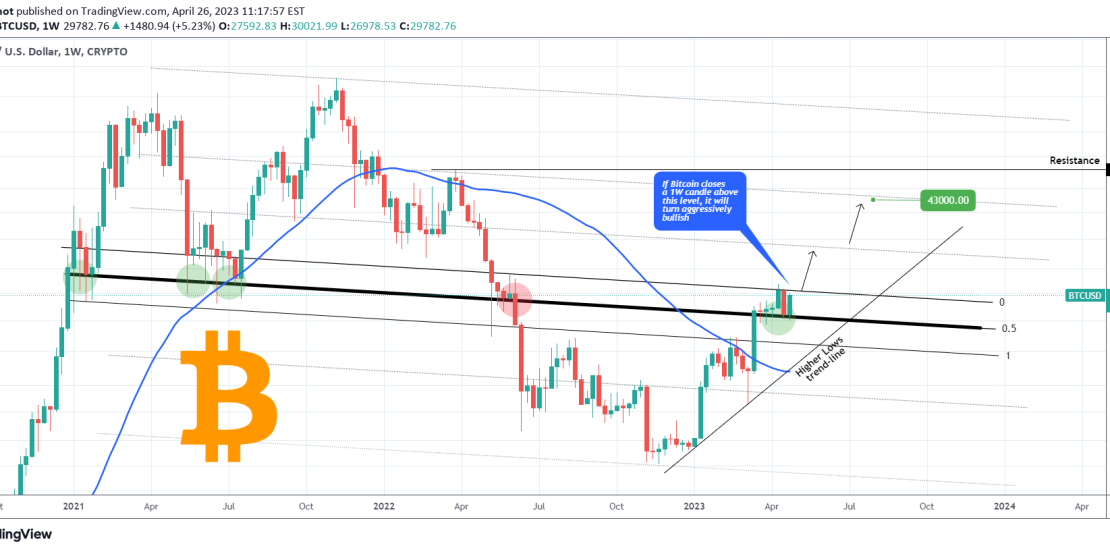
Bitcoin (BTCUSD) is rebounding off the 0.5 Fibonnaci Lower Lows trend-line that provided Support numerous times during the previous Cycle but when it finally closed a 1W candle below it (June 06 2022) it started the final bearish sequence. Currently this is very positive for the upside’s chances and if BTC manages to close a
-
SILVER/GOLD ratio showing Gold will outperform
- April 26, 2023
- Posted by: Tradingshot Articles
- Category: Commodities
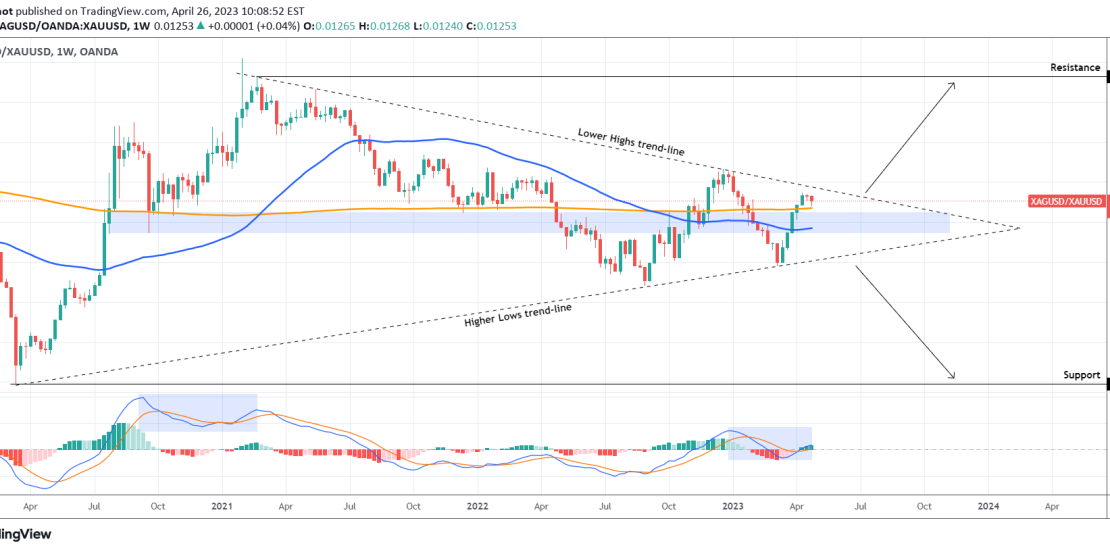
The Silver/ Gold ratio on the 1W time-frame shows the price trading within a Triangle pattern, with the price almost reaching the top two weeks ago and currently getting rejected. On the long-term, the break-out of this pattern will determine the next trend so be prepared but as long as it holds, then Gold (XAUUSD)
-
XRDUSD Don’t be fooled by this rise
- April 26, 2023
- Posted by: Tradingshot Articles
- Category: Cryptocurrency
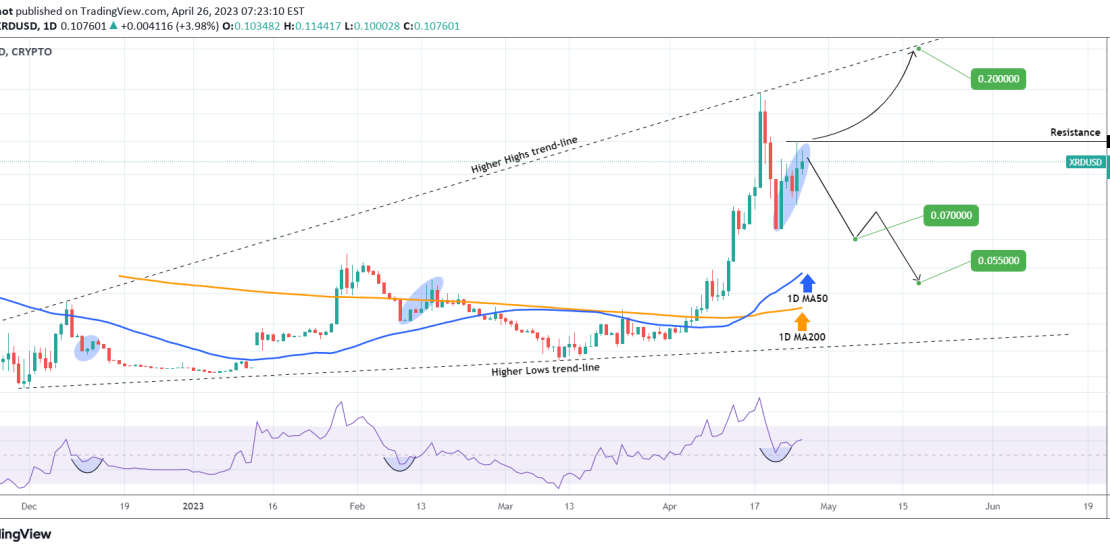
Radix (XRDUSD) is on a strong rise in the past five days. However, unless it closes above the 0.1200 Resistance, it is more likely to seek Support on either the 1D MA50 (blue trend-line) or the 1D MA200 (orange trend-line) before making a new High. That is because based on the 1D RSI, the current
-
WTI OIL Filling the downside gap but short-term rebound.
- April 24, 2023
- Posted by: Tradingshot Articles
- Category: Commodities
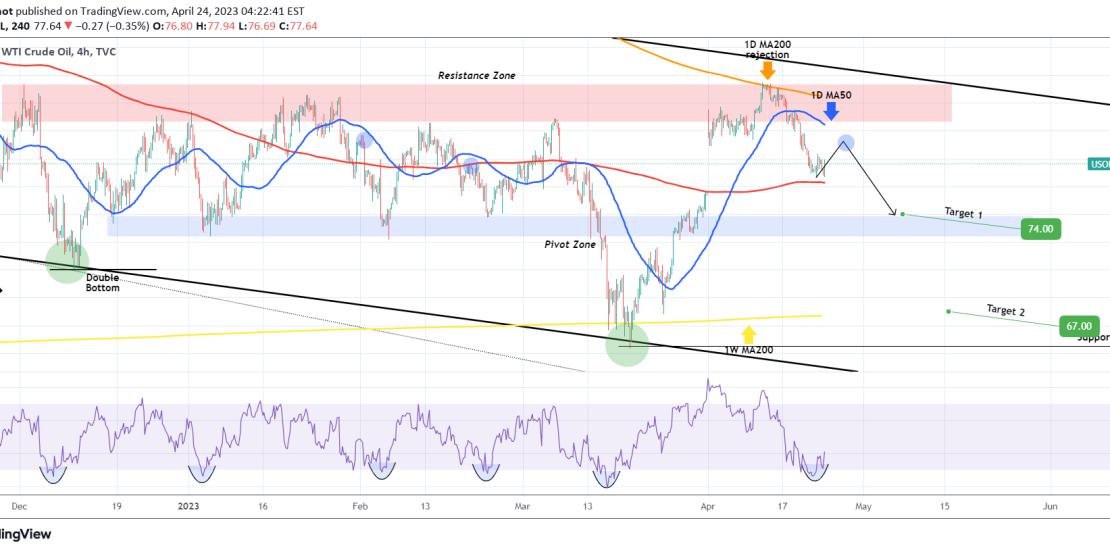
The WTI Oil (USOIL) got, as we expected, heavily rejected on the 1D MA200 (orange trend-line), starting to fill the gap of March: Our next target is 74.00, just above the Pivot Zone, but on the short-term, with the 4H RSI rebounding after getting oversold (has given a 100% buy signal short-term in the past
-
NZDUSD Trade long-term based on this Channel Down.
- April 24, 2023
- Posted by: Tradingshot Articles
- Category: Forex
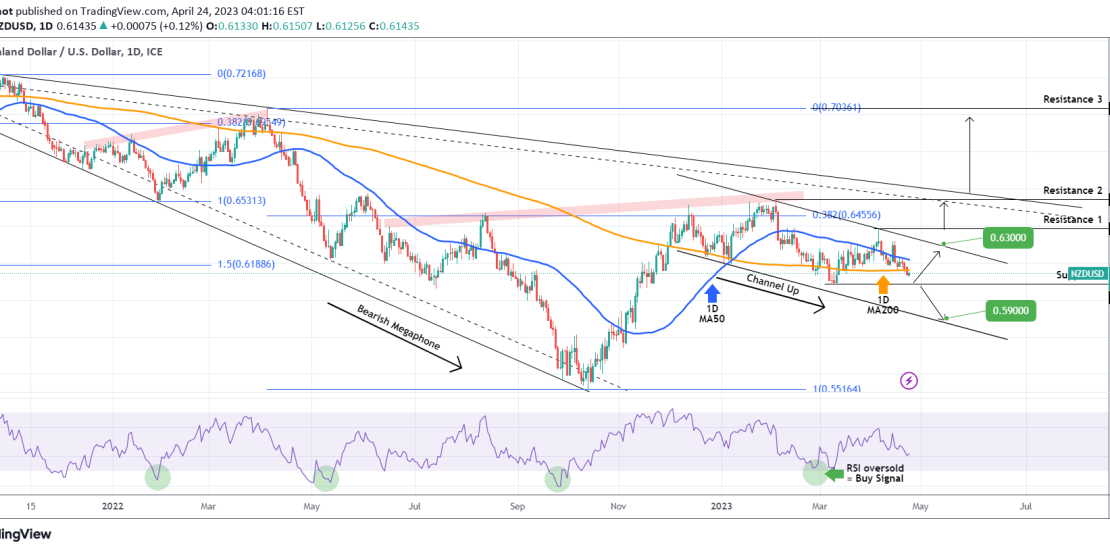
The NZDUSD pair is trading within a Channel Down pattern, having just broken below the 1D MA200 (orange trend-line). The short-term Resistance is the 1D MA50 (blue trend-line). The key here is the 0.60850 Support. As long as it holds, expect a rise back to the top of the Channel Down, with our target being
-
BITCOIN Cycle Phases in a very demonstrative way!
- April 24, 2023
- Posted by: Tradingshot Articles
- Category: Cryptocurrency
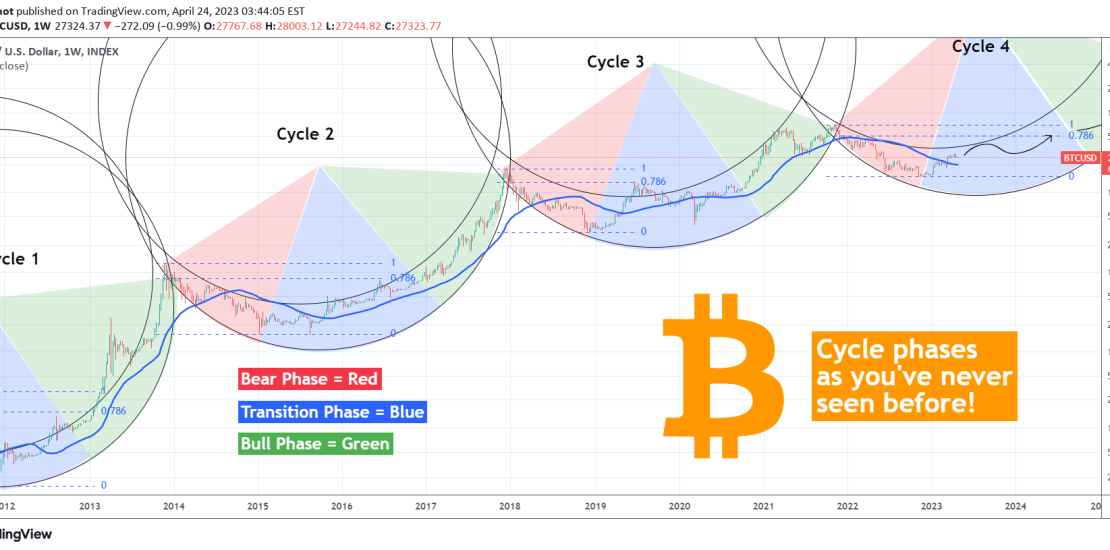
post, we are looking into Cyclical phase and demonstrate them in a way like you’ve never seen before! Each Cycle consists of the Bear (red), Transition (blue) and Bull (green) Phases. The Bear Phase ends at the bottom of the Cycle, where the Transition starts and typically after the price breaks above the 0.786 Fibonacci
-
POLYUSD testing the 2021 Resistance!
- April 21, 2023
- Posted by: Tradingshot Articles
- Category: Cryptocurrency
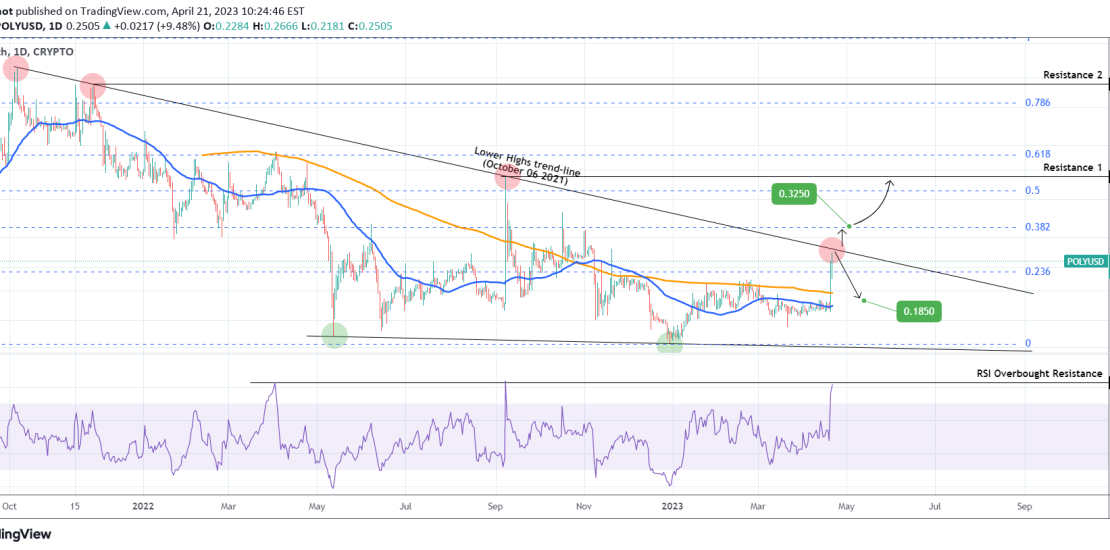
Polymath (POLYUSD) is having an incredible 2-day stretch and is testing the Lower Highs trend-line (from October 06 2021) for the first time September 08 2022. A 1D candle closing above it will be a buy signal for us, targeting 0.3250 (the 0.382 Fibonacci) on the short-term and if another candle closes above it, then
-
BITCOIN being pumped after China bonds macro cycle bottom
- April 21, 2023
- Posted by: Tradingshot Articles
- Category: Cryptocurrency
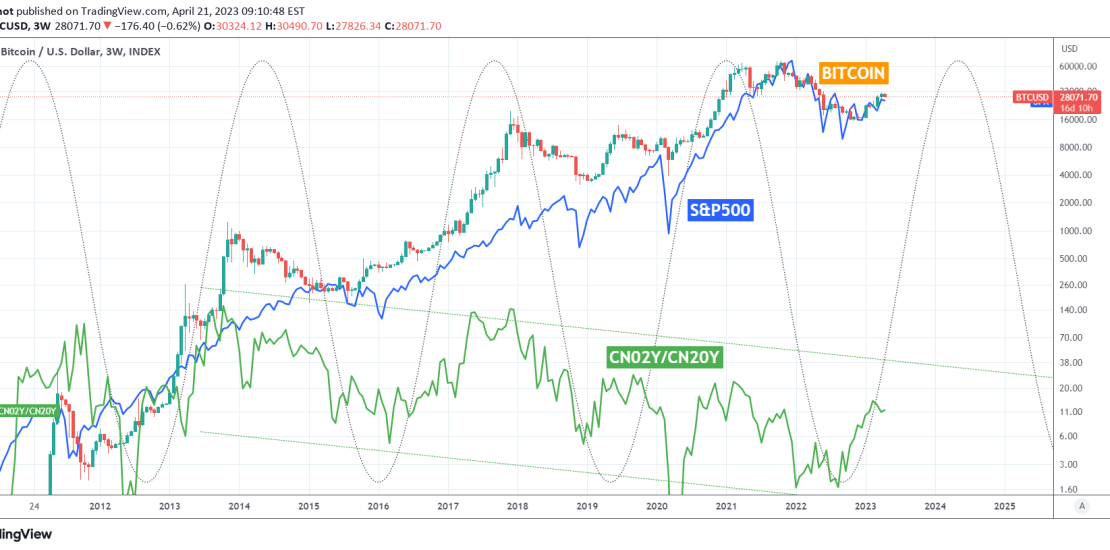
It is not the first time we look into how the Chinese bonds (with our unique CN02Y/CN20Y ratio displayed by the green trend-line) affect Bitcoin’s (BTCUSD) Cycles: It is however the first time we add stocks (S&P500 with the blue trend-line) in the mix. We can see the Cyclical behavior of the bond yields ratio
