

- April 27, 2023
- Posted by: Tradingshot Articles
- Category: Cryptocurrency
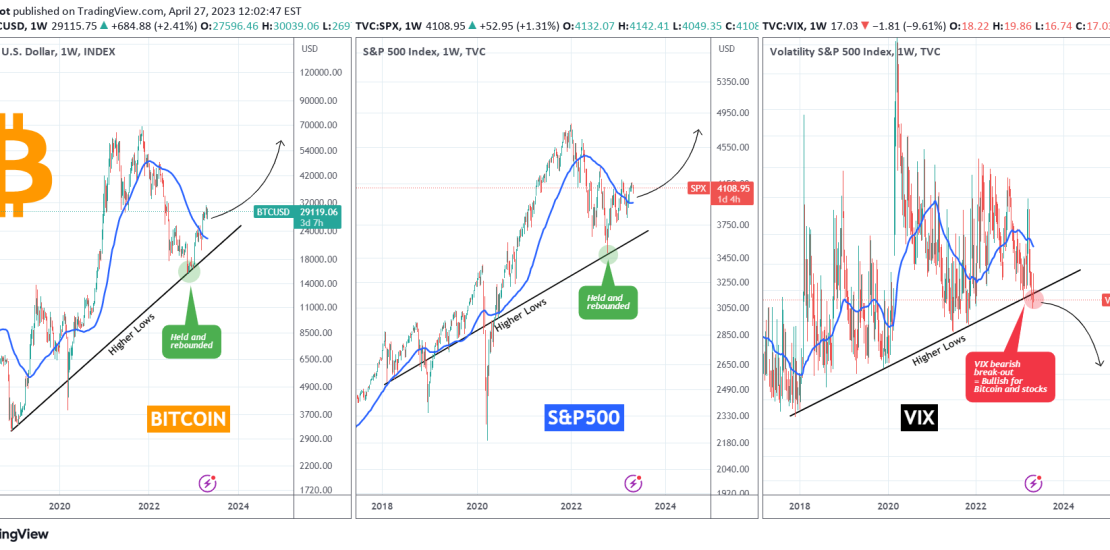
You may be wondering what Bitcoin (BTCUSD) has to do with the S&P500 index (SPX) and the Volatility Index (VIX). Well this chart gives you the answer and sets the tone for the remainder of the year and beyond.
As you see Bitcoin (chart on the left) rebounded on the Higher Lows trend-line that started on the December 2018 Low (and only broke during the COVID crash). The S&P500 (chart in the middle) is following a similar pattern as its Higher Lows trend-line (that only broke during the U.S. – China trade war and the COVID crash) held and gave the index a push last October.
At the same time VIX (chart on the right) has been holding its Higher Lows trend-line up until this month (April). This bearish break-out implies that the index that measures the market volatility will most likely drop further indicating a decline in uncertainty and setting a risk-on tone for stocks and crypto alike. The lower the volatility, the higher risky assets such as stocks and crypto trade.
Do you think that will be the case for the rest of the year and probably beyond after this bearish break-out on VIX? Feel free to let us know in the comments section below!
Tradingview link: