
-
XAUUSD We caught the bottom buy, now how high can it extend?
- March 6, 2023
- Posted by: Tradingshot Articles
- Category: Commodities
No Comments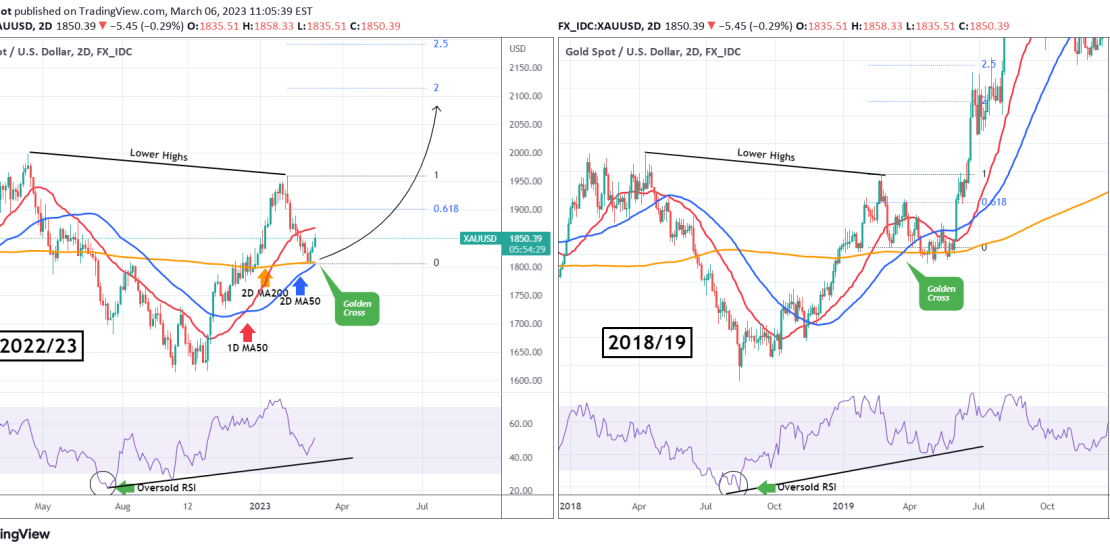
Ten days ago we called a bottom on the exact market buy for Gold (XAUUSD) as the 1D RSI was approaching the oversold level: This time we bring you an even more extensive perspective on the 2D time-frame, having found a fractal from 2019 that can lead Gold much higher than most anticipate, assuming of
-
S&P500 The huge Inverse H&S has started and its target is 4700!
- March 6, 2023
- Posted by: Tradingshot Articles
- Category: Stock Indices
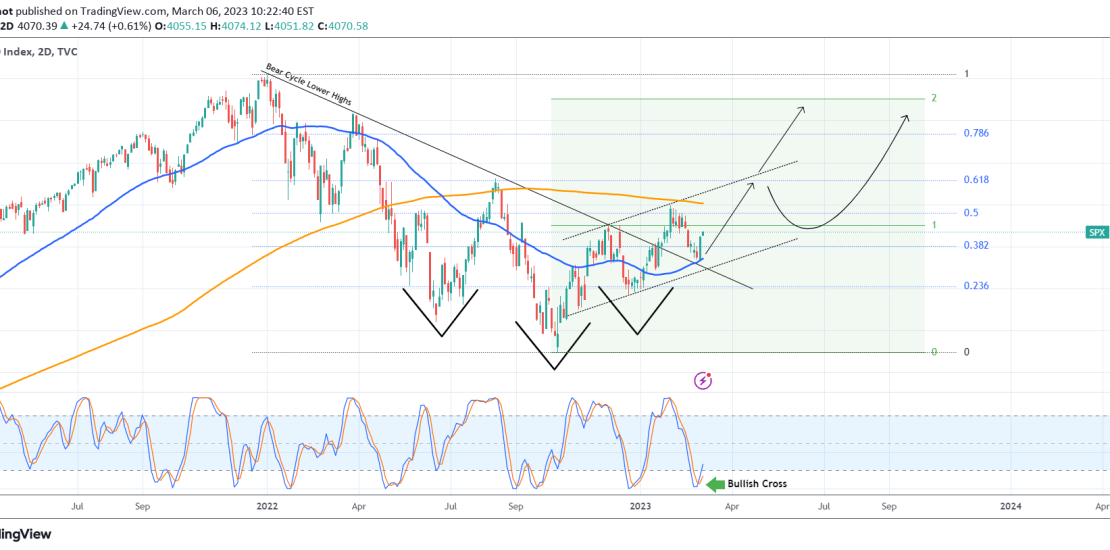
Last week we have made clear our short/ medium-term view on the S&P500 (SPX), calling a buy on the exact bottom of the Channel Up: It is time to look again, as we normally do on a monthly basis, on the bigger picture, looking at the 2D time-frame. The Channel Up is clear and so
-
BITCOIN Moment of truth to confirm or dismiss the 2019 fractal!
- March 6, 2023
- Posted by: Tradingshot Articles
- Category: Cryptocurrency
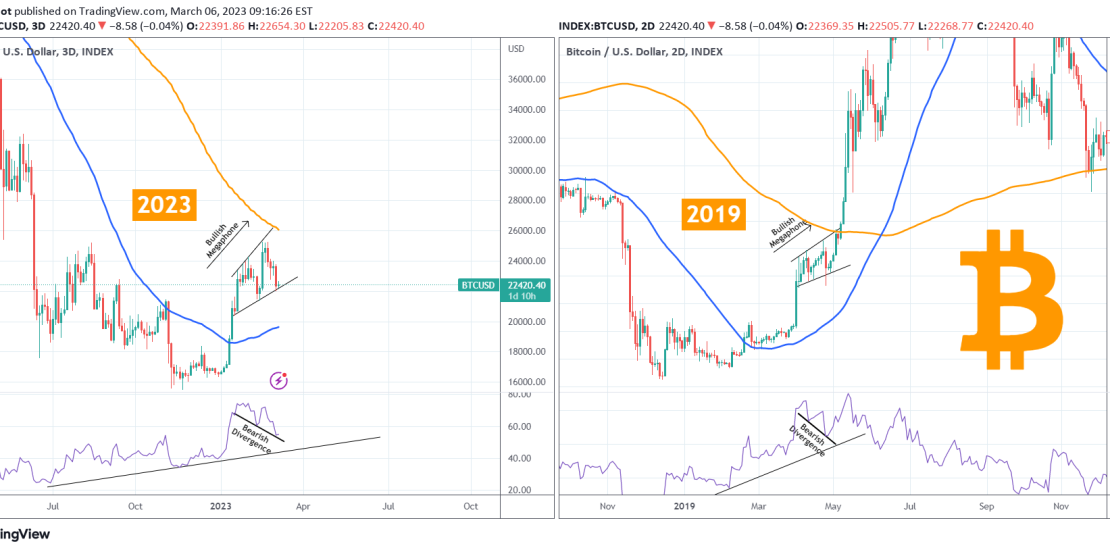
There has been tons of talk about Bitcoin’s (BTCUSD) similarity of the current bottom reversal with the 2019 one. A lot of comparisons have been made, we’ve started doing that since November, but the time has come that BTC either confirms or dismisses the 2019 fractal. As you see on the left chart (2023) the
-
USDCAD Multi-week sideways opportunity
- March 2, 2023
- Posted by: Tradingshot Articles
- Category: Forex
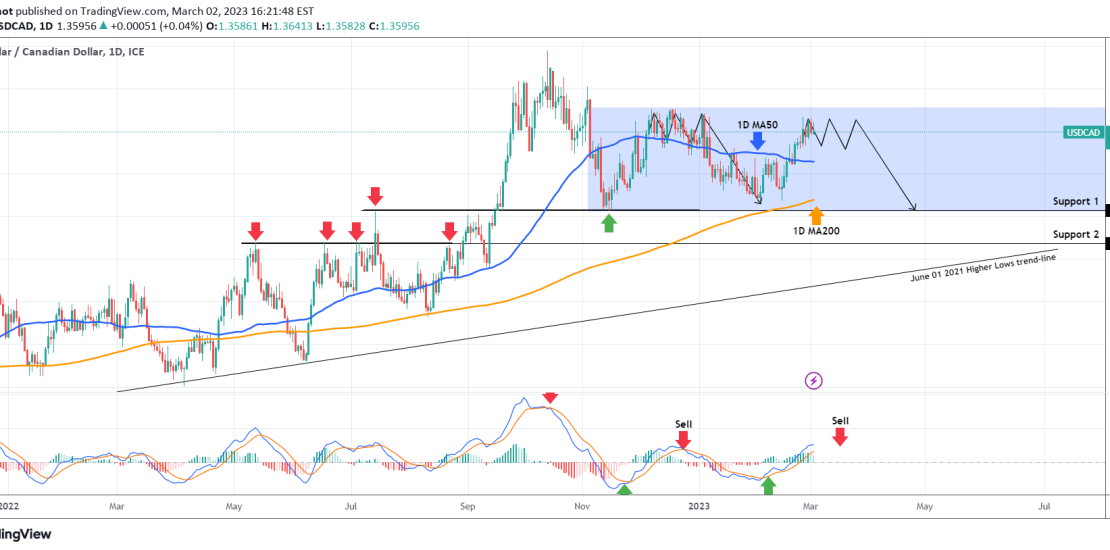
The USDCAD pair topped back in October and has turned sideways inside a Rectangle pattern since the November 15 Low. With the 1D MA50 (blue trend-line) used as the Pivot, the 1D MACD indicator can offer a confirmed buy and sell entry when it makes a Bullish and Bearish Cross respectively. Notice when Support 1
-
NASDAQ Its weekly Pivot closing determines the long-term trend
- March 2, 2023
- Posted by: Tradingshot Articles
- Category: Stock Indices
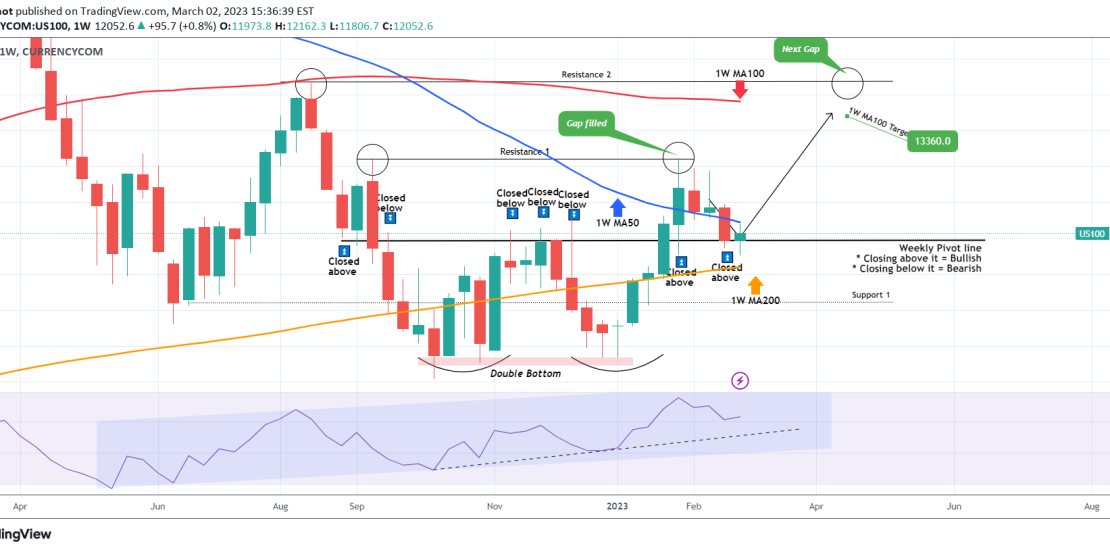
Last week we looked into Nasdaq (NDX) from a 1D perspective, giving emphasis on the important of the 1D MA200 and 1D MA50 as Supports, giving emphasis on the Pivot Zone involved since September: It is important now to show you why this level is important for the long-term, this time on the 1W time-frame.
-
WTI OIL One last upside target. This is the signal to sell.
- March 2, 2023
- Posted by: Tradingshot Articles
- Category: Commodities
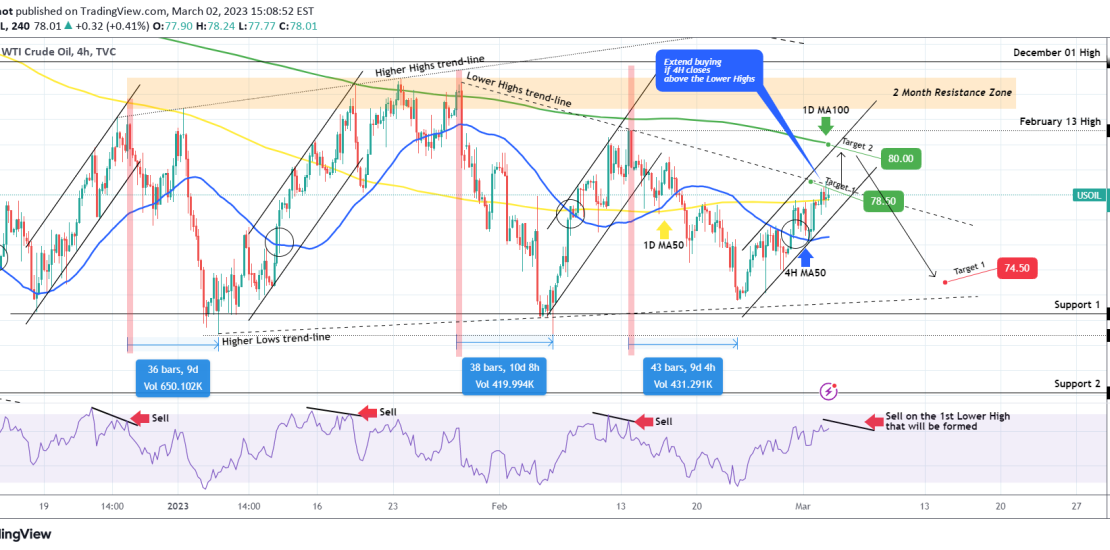
We are updating our WTI Oil (USOIL) outlook on last week’s buy signal: Target 1 (78.50) has been hit as the price reached the Lower Highs trend-line that started on the January 27 High. If a 4H candle closes above this trend-line, you can extend buying towards Target 2 (80.00), which is where the 1D
-
BITCOIN Limited by the weekly candle body Resistance.
- March 2, 2023
- Posted by: Tradingshot Articles
- Category: Cryptocurrency
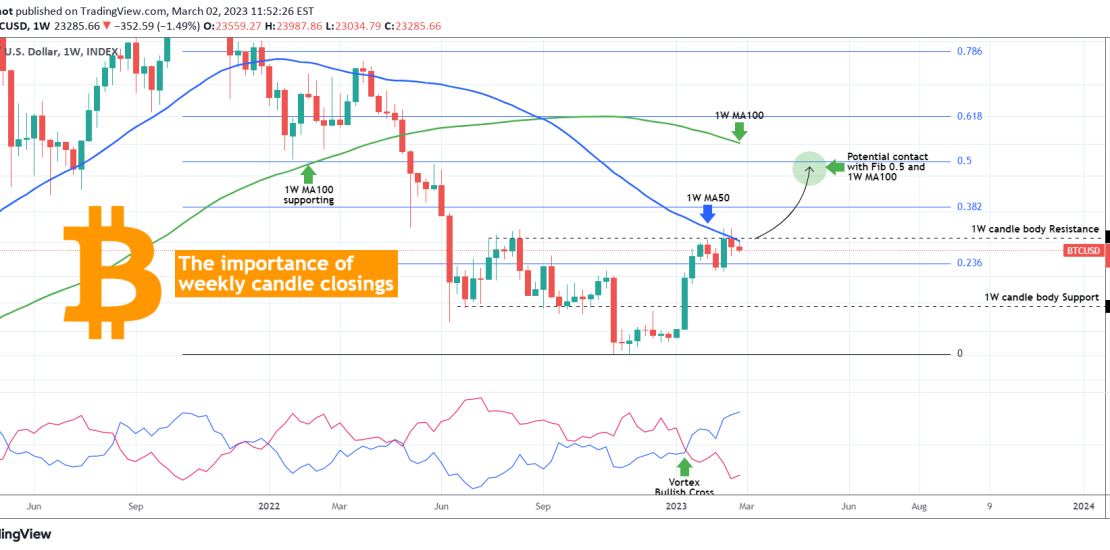
Many have been focusing in the past days at the inability of Bitcoin (BTCUSD) to close above the 1W MA50 (blue trend-line). Surely that is essential for maintaining the pace of the January – February rally and as we’ve analyzed recently, it draws comparisons with the past Cycles where they were testing their own 1W
-
AMD Targeting $95.00
- March 1, 2023
- Posted by: Tradingshot Articles
- Category: Stocks
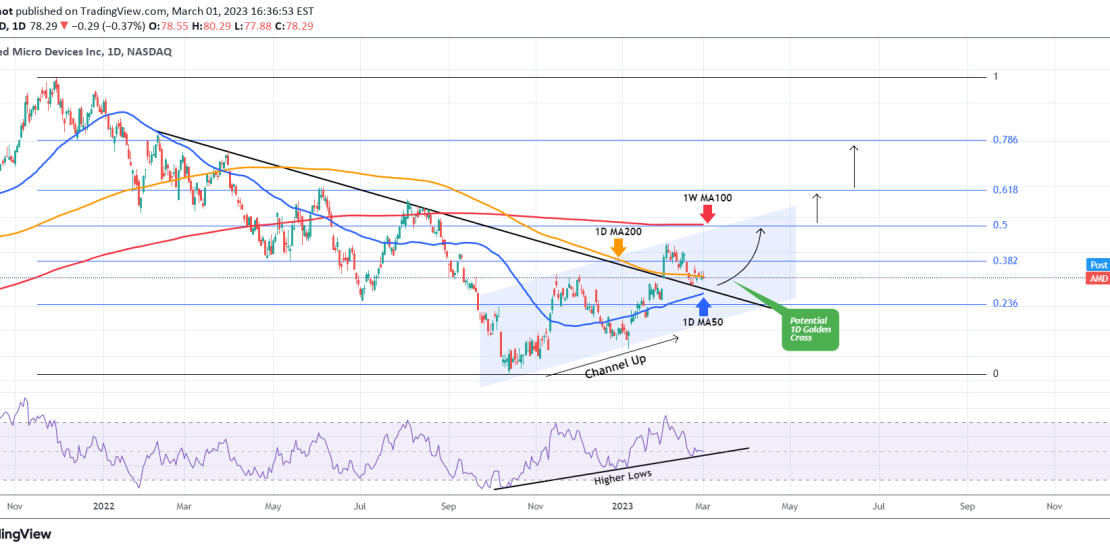
Advanced Micro Devices (AMD) are trading within a Channel Up pattern since the October 13 Low and is about to form a 1D Golden Cross. The 0.5 Fibonacci retracement level is exactly on the 1W MA100 (red trend-line) and we set a medium-term term target on it at $95.00. We expect every closing above each
-
ELI LILLY on the best buy opportunity of the year!
- March 1, 2023
- Posted by: Tradingshot Articles
- Category: Stocks
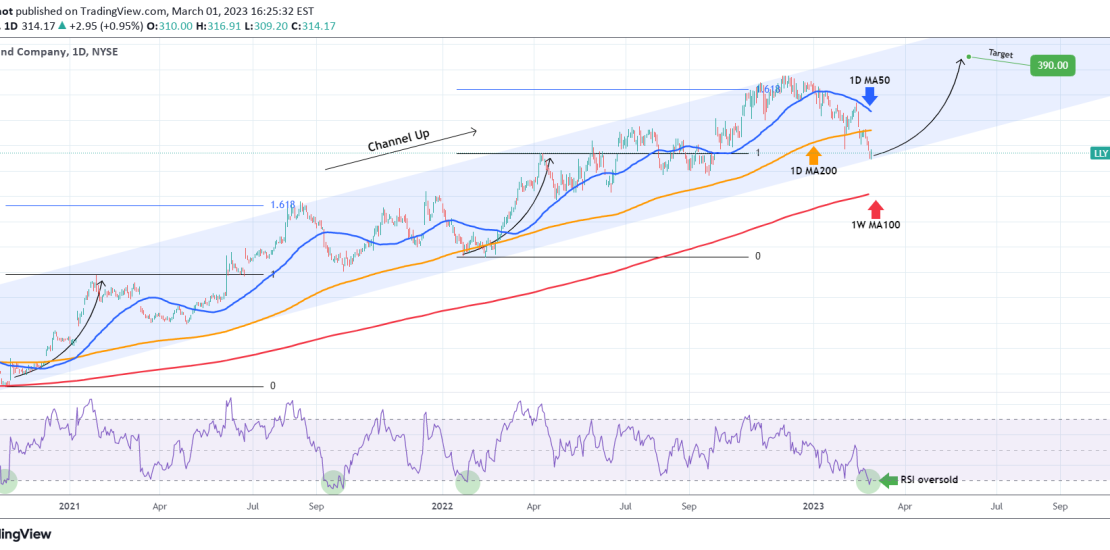
Eli Lilly and Company (LLY) has been trading within a Channel Up pattern since the October 30 2020 low exactly on the 1W MA100 (red trend-line). As the 1D RSI turned oversold below the 30.00 barrier, while the price touched the bottom (Higher Lows trend-line) of the Channel Up, it has filled all conditions for
-
S&P500 Bottom by tomorrow, slow 2-week recovery after.
- March 1, 2023
- Posted by: Tradingshot Articles
- Category: Stock Indices
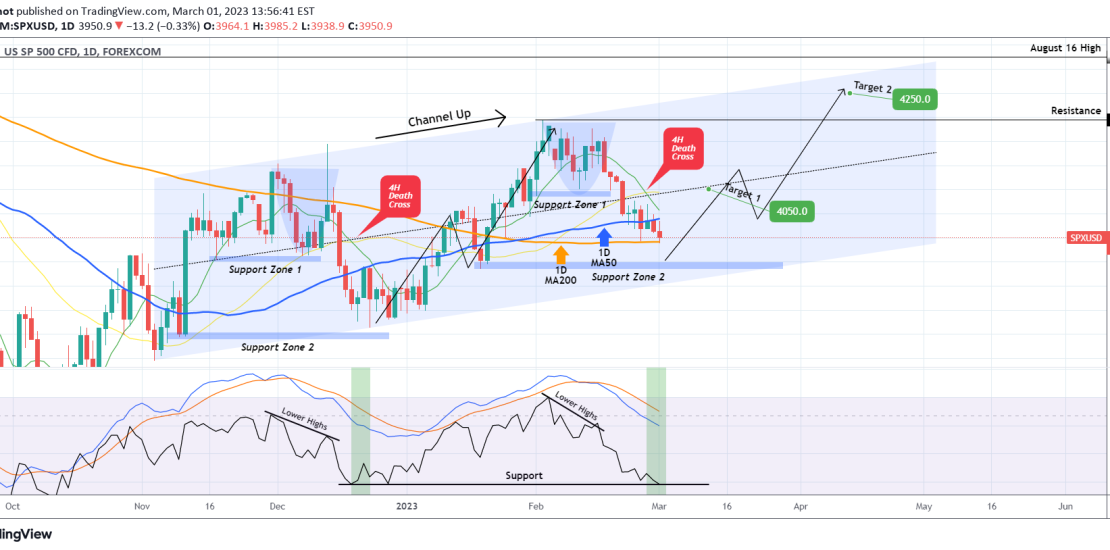
The S&P500 index (SPX) is trading between its 1D MA50 (blue trend-line) and 1D MA200 (orange trend-line) ad the long-term Channel Up pattern that started on the November 03 Low is attempting to price its new Lower High. Based on the symmetry provided by the 1D RSI that is on the 39.00 Support (Dec 19
