

- March 2, 2023
- Posted by: Tradingshot Articles
- Category: Cryptocurrency
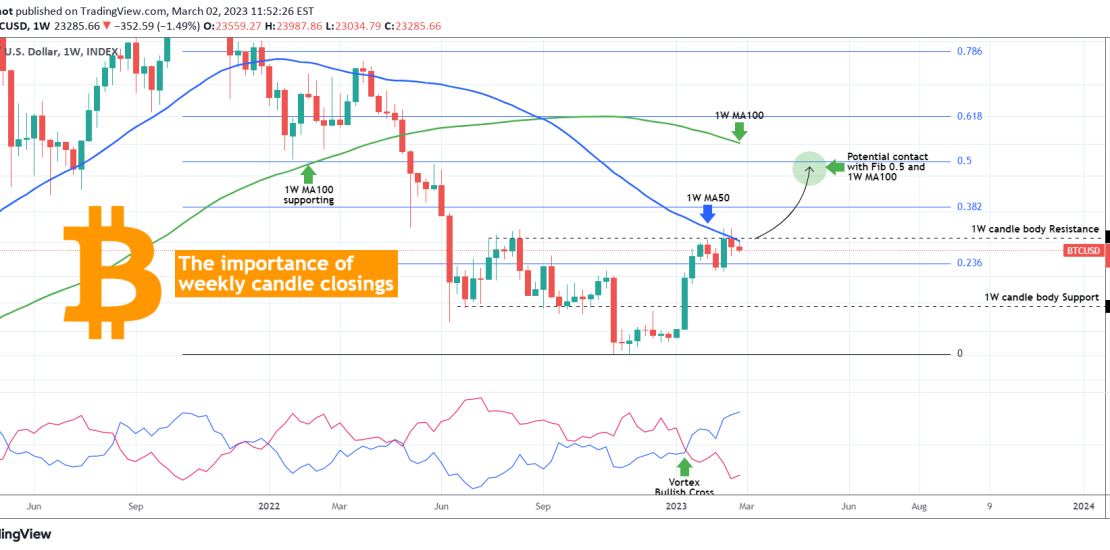
Many have been focusing in the past days at the inability of Bitcoin (BTCUSD) to close above the 1W MA50 (blue trend-line). Surely that is essential for maintaining the pace of the January – February rally and as we’ve analyzed recently, it draws comparisons with the past Cycles where they were testing their own 1W MA50.
** Resistance/ Support levels based on the 1W candle closing **
Another, overlooked for sure, aspect on the 1W time-frame the Resistance/ Support levels enforced by the 1W (weekly) candle closings. As you see on this chart, BTC not only failed to close (despite breaking it) above the 1W MA50 in the previous 2 weeks but also failed to close those candles above the 24360 Resistance which has been formed since the weekly candle of July 18 2022. As you see no candle closed above that Resistance level in July – August and the recent failures certainly show its importance. The same can be said about the 1W candle body Support at 18750, which held all weekly closings above it from June until the FTX crash.
** The Vortex Indicator **
As a result, a weekly close above 24360 will achieve a double bullish break-out as not only will it close above the 1W MA50 for the first time since April 25 2022 but also above the most important horizontal Resistance on the 1W time-frame. In order to keep things into a long-term perspective, we have added on this analysis the Vortex Indicator (VI), widely used in previous years, that has been on a Bullish Cross since mid-January. This shows that the new Bull Cycle has started and is still in its early stages.
** Projection **
It appears that even though they are not absolute, the Fibonacci retracement levels will play some part as Resistance levels in this new rally. Once BTC makes this double bullish break-out, we have the 1W M100 (green trend-line) as the next pressure level, hence potential Target and if the second part of the rally is as strong as January, it can make contact with the 1W MA100 around the 0.5 Fibonacci level, which is roughly at $32650.
So what do think? Is this 1W candle body Resistance the level to break? Feel free to let us know in the comments section below!
Tradingview link: