

- March 6, 2023
- Posted by: Tradingshot Articles
- Category: Commodities
Ten days ago we called a bottom on the exact market buy for Gold (XAUUSD) as the 1D RSI was approaching the oversold level:

This time we bring you an even more extensive perspective on the 2D time-frame, having found a fractal from 2019 that can lead Gold much higher than most anticipate, assuming of course the global market fundamentals continue to be the same.
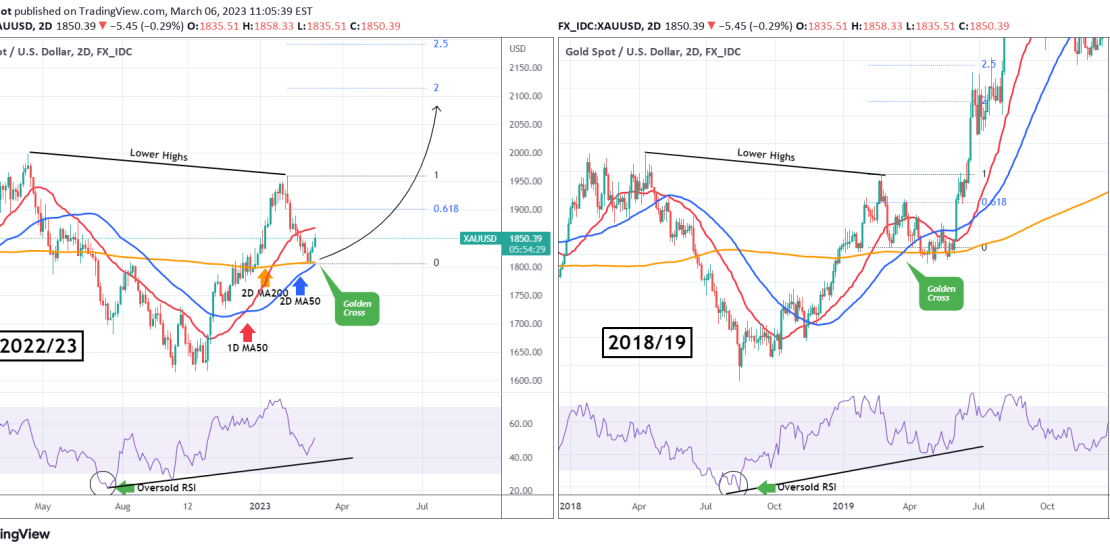
As you see the two sequences (2022/23 on the left and 2018/19 on the right) share almost the exact characteristics, both starting a rally on an extremely oversold RSI (when most least expected it), having a rejection on a Lower Highs trend-line, finding Support on the 2D MA200 (orange trend-line) and forming a Golden Cross. This is where the current (2023) fractal stops as the first rally since the February High has started.
In 2019 the price broke easily above the 1D MA50 (red trend-line) but was rejected on its 0.618 Fibonacci retracement level, which made it fall more and make a marginally Lower Low, before th eventual hyper aggressive parabolic rally started that had a first stop on the 2.5 Fibonacci extension. On the 2023 fractal, the 0.618 Fib is at 1900. In 2019 this was formed exactly on the Golden Cross. The new Golden Cross will be completed tomorrow. If Gold doesn’t reach 1900 by then and continues to rise, it is possible to ignore the bias of the 2019 fractal for one last Lower Low. A closing above the 0.618 Fib may also invalidate that. In any case, even in the event of one last pull-back, you can reserve a spot for one additional buy just under the 2D MA200. The target will more than make up for this risk as if the fractal is repeated, then the upside by the end of Summer can be anywhere within 2110 – 2190.
Tradingview link: