

2023 March
-
XAUUSD Oversold RSI, bottom of the Channel = Buy opportunity
- March 7, 2023
- Posted by: Tradingshot Articles
- Category: Commodities
No Comments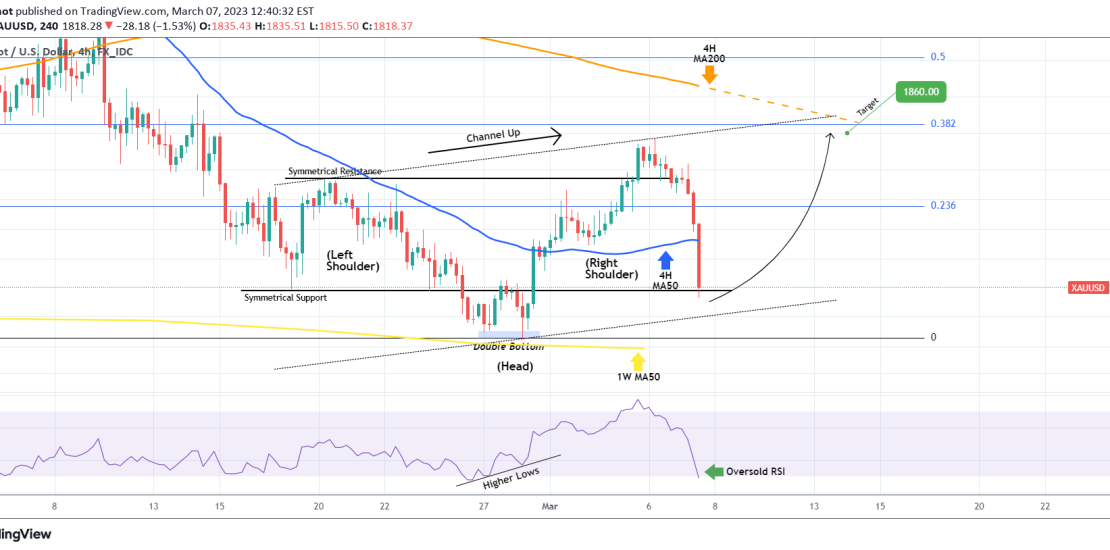
Gold (XAUUSD) got a massive rejection following Powell’s comments on the potential of higher interest rate hikes. It hit the Symmetrical Support level of the Inverse Head & Shoulders pattern we outlined on our previous analysis and so far seems to be rebounding. A potential Channel Up gives room for some more decline before an
-
APPLE Inverse Head and Shoulders give a new All Time High
- March 6, 2023
- Posted by: Tradingshot Articles
- Category: Stocks
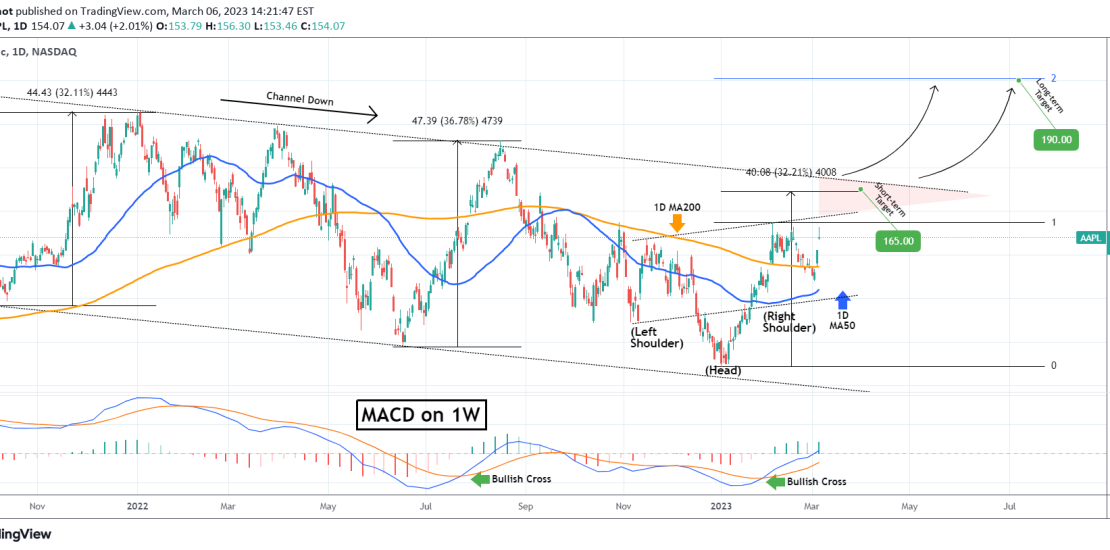
Apple Inc. (AAPL) has just completed an Inverse Head and Shoulders pattern, with its Head being the January 03 market Bottom. The Bear Cycle isn’t technically over for Apple as the Channel Down that started back on the October 04 2021 Low hasn’t yet been broken. In fact since the last two Lower Highs sequences
-
US10Y Double rejection. Targeting the 1D MA200.
- March 6, 2023
- Posted by: Tradingshot Articles
- Category: Other
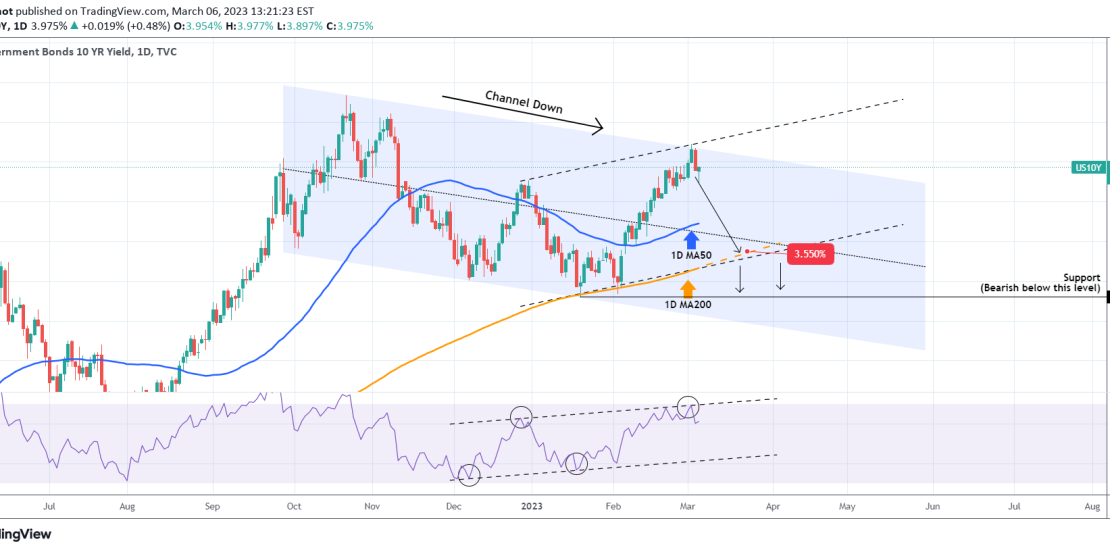
The U.S. Government Bonds 10YR Yield (US10Y) has been trading within a Channel Down pattern ever since the October 21 2022 High and even though there might be a Diverging Channel Up (dashed lines) emerging, the current level makes a strong Resistance cluster. With the 1D RSI also rejected twice on its Higher Highs trend-line,
-
XAUUSD We caught the bottom buy, now how high can it extend?
- March 6, 2023
- Posted by: Tradingshot Articles
- Category: Commodities
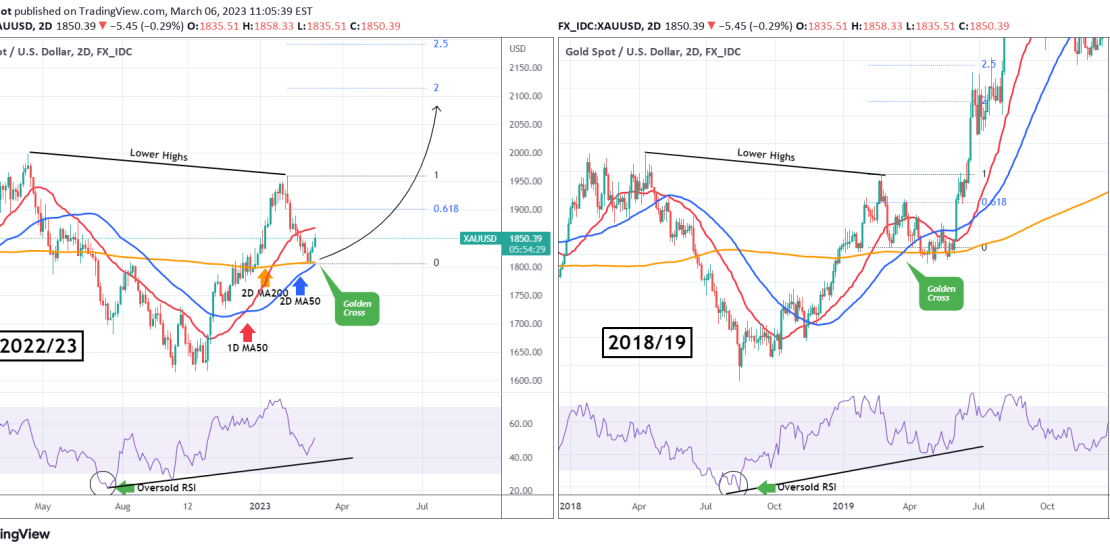
Ten days ago we called a bottom on the exact market buy for Gold (XAUUSD) as the 1D RSI was approaching the oversold level: This time we bring you an even more extensive perspective on the 2D time-frame, having found a fractal from 2019 that can lead Gold much higher than most anticipate, assuming of
-
S&P500 The huge Inverse H&S has started and its target is 4700!
- March 6, 2023
- Posted by: Tradingshot Articles
- Category: Stock Indices
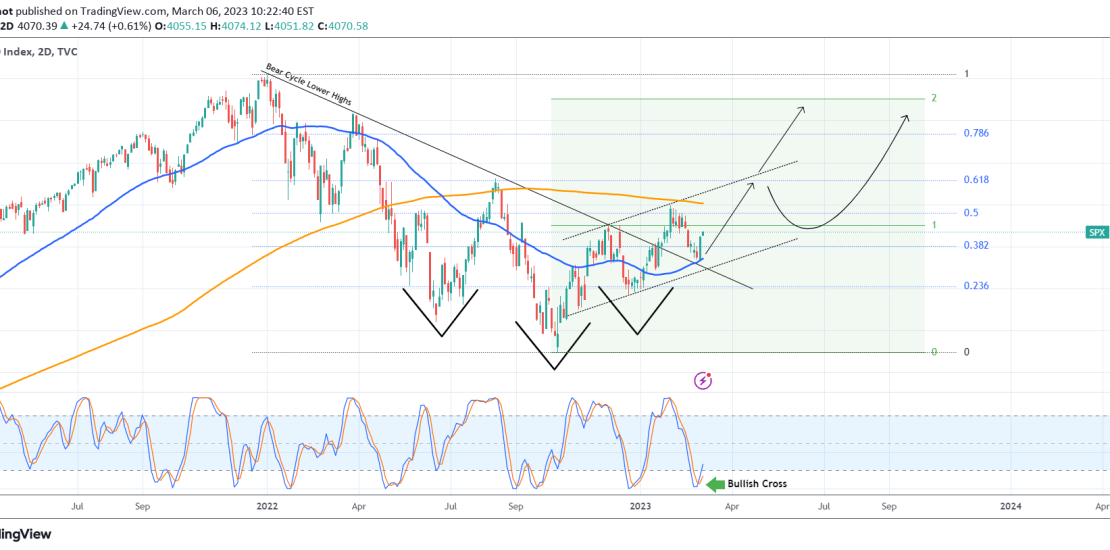
Last week we have made clear our short/ medium-term view on the S&P500 (SPX), calling a buy on the exact bottom of the Channel Up: It is time to look again, as we normally do on a monthly basis, on the bigger picture, looking at the 2D time-frame. The Channel Up is clear and so
-
BITCOIN Moment of truth to confirm or dismiss the 2019 fractal!
- March 6, 2023
- Posted by: Tradingshot Articles
- Category: Cryptocurrency
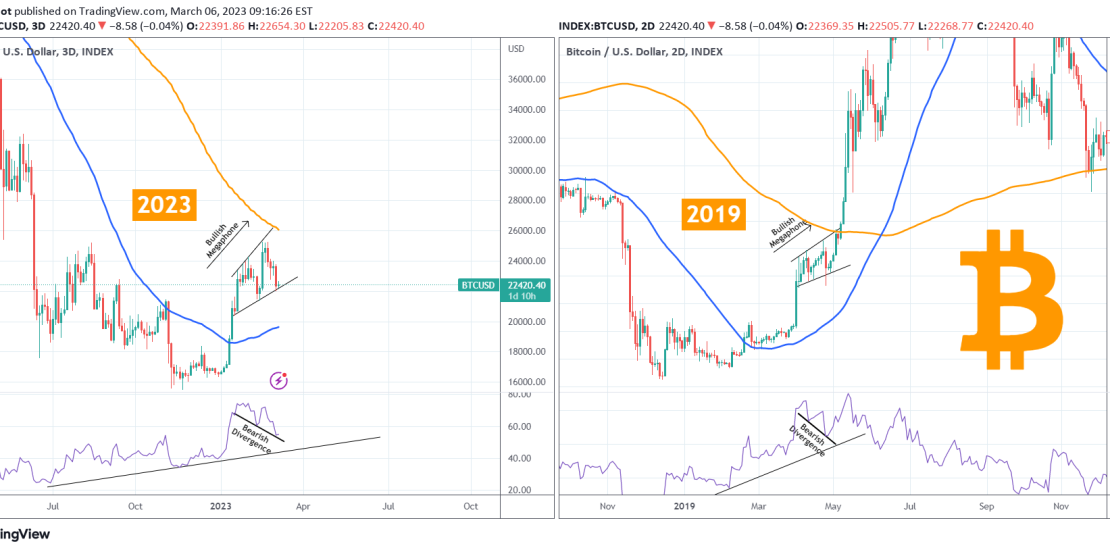
There has been tons of talk about Bitcoin’s (BTCUSD) similarity of the current bottom reversal with the 2019 one. A lot of comparisons have been made, we’ve started doing that since November, but the time has come that BTC either confirms or dismisses the 2019 fractal. As you see on the left chart (2023) the
-
USDCAD Multi-week sideways opportunity
- March 2, 2023
- Posted by: Tradingshot Articles
- Category: Forex
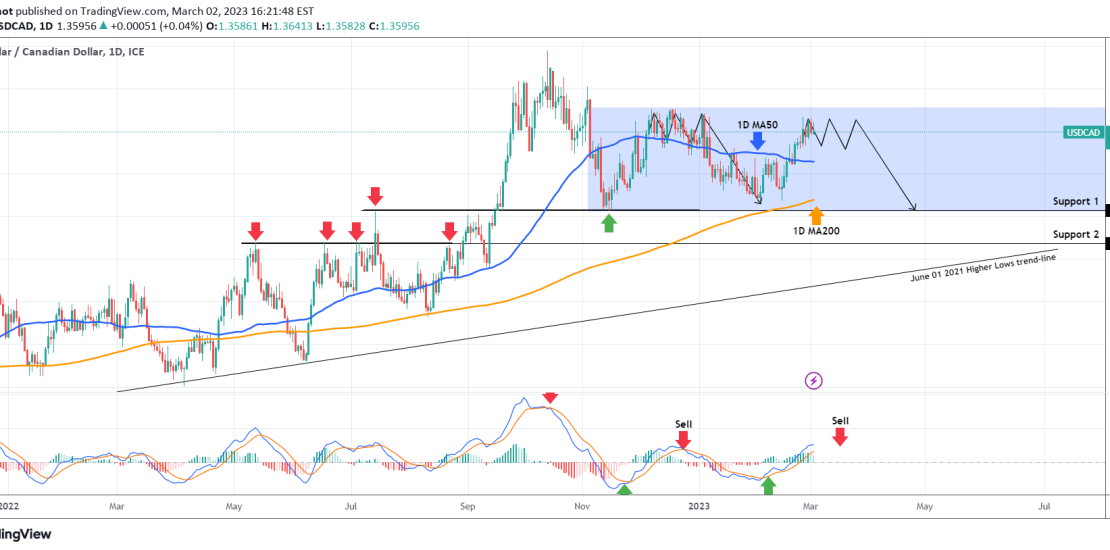
The USDCAD pair topped back in October and has turned sideways inside a Rectangle pattern since the November 15 Low. With the 1D MA50 (blue trend-line) used as the Pivot, the 1D MACD indicator can offer a confirmed buy and sell entry when it makes a Bullish and Bearish Cross respectively. Notice when Support 1
-
NASDAQ Its weekly Pivot closing determines the long-term trend
- March 2, 2023
- Posted by: Tradingshot Articles
- Category: Stock Indices
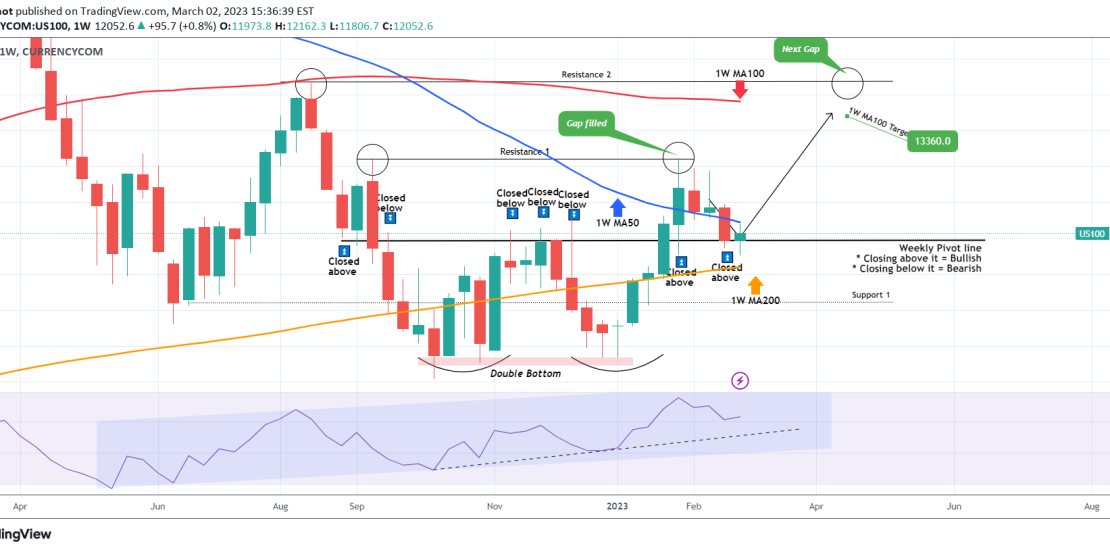
Last week we looked into Nasdaq (NDX) from a 1D perspective, giving emphasis on the important of the 1D MA200 and 1D MA50 as Supports, giving emphasis on the Pivot Zone involved since September: It is important now to show you why this level is important for the long-term, this time on the 1W time-frame.
-
WTI OIL One last upside target. This is the signal to sell.
- March 2, 2023
- Posted by: Tradingshot Articles
- Category: Commodities
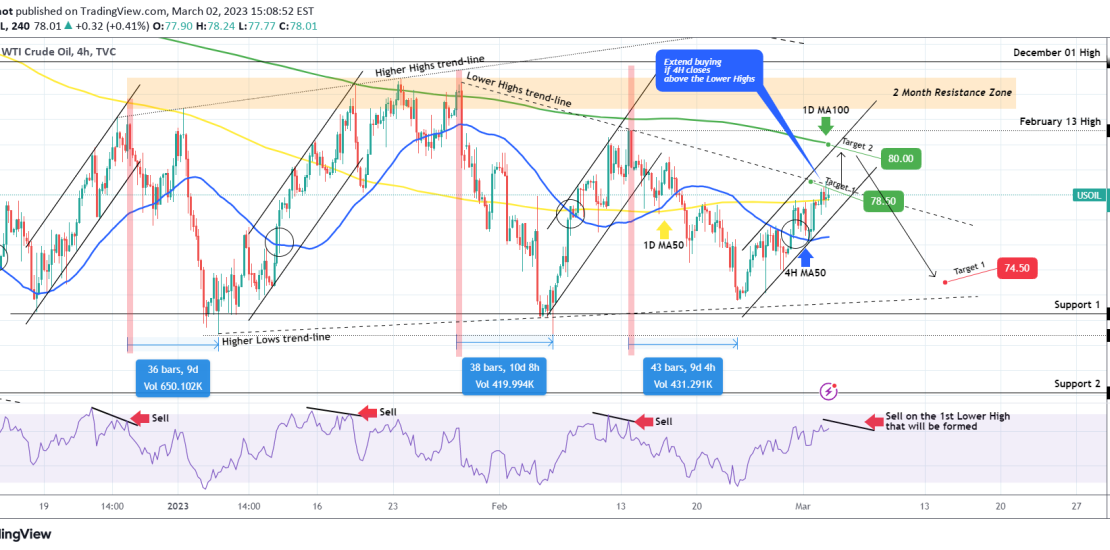
We are updating our WTI Oil (USOIL) outlook on last week’s buy signal: Target 1 (78.50) has been hit as the price reached the Lower Highs trend-line that started on the January 27 High. If a 4H candle closes above this trend-line, you can extend buying towards Target 2 (80.00), which is where the 1D
-
BITCOIN Limited by the weekly candle body Resistance.
- March 2, 2023
- Posted by: Tradingshot Articles
- Category: Cryptocurrency
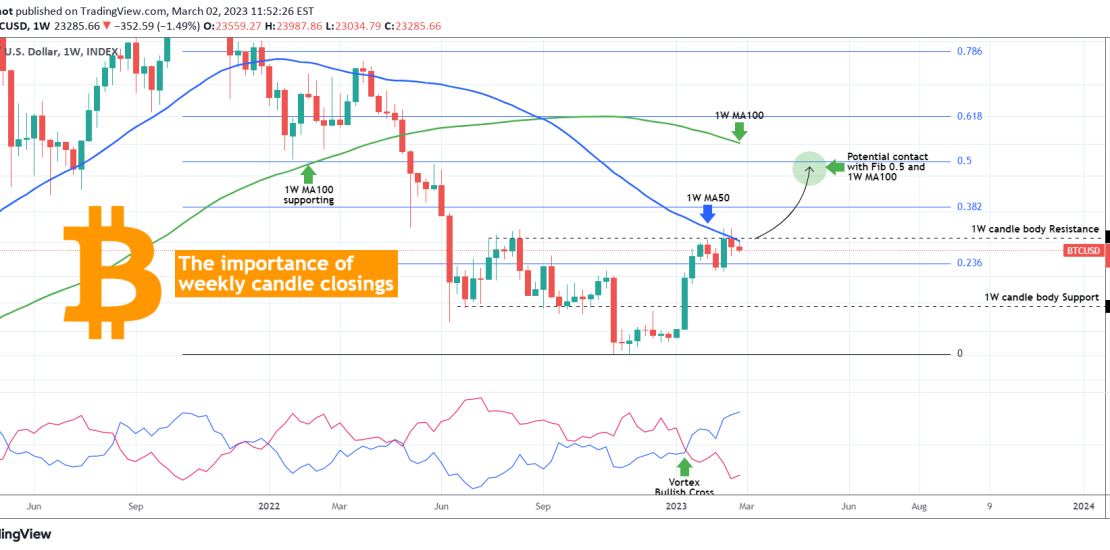
Many have been focusing in the past days at the inability of Bitcoin (BTCUSD) to close above the 1W MA50 (blue trend-line). Surely that is essential for maintaining the pace of the January – February rally and as we’ve analyzed recently, it draws comparisons with the past Cycles where they were testing their own 1W