

2023 January
-
DXY Testing the 4H MA50. Short-term Resistance.
- January 23, 2023
- Posted by: Tradingshot Articles
- Category: Forex
No Comments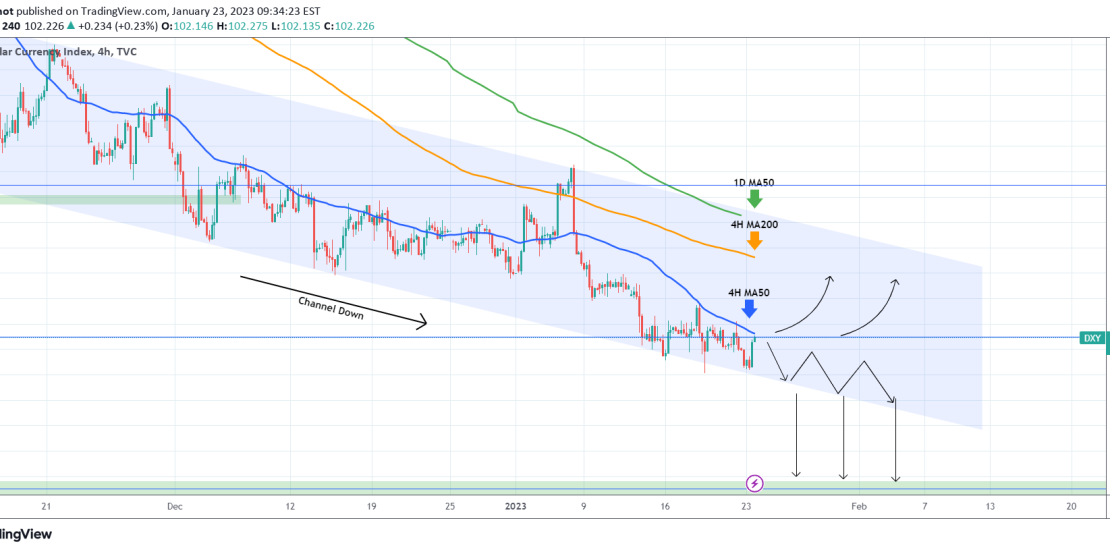
The U.S. Dollar Index (DXY) it currently testing its 4H MA50 (blue trend-line), which has caused two rejections last week and has been closing all 4H candles below it since January 06. As long as it continues to do so, we expect a short-term bearish trend between that and the medium-term Channel Down that has
-
META The worst is history! 6 straight green weeks.
- January 22, 2023
- Posted by: Tradingshot Articles
- Category: Stocks
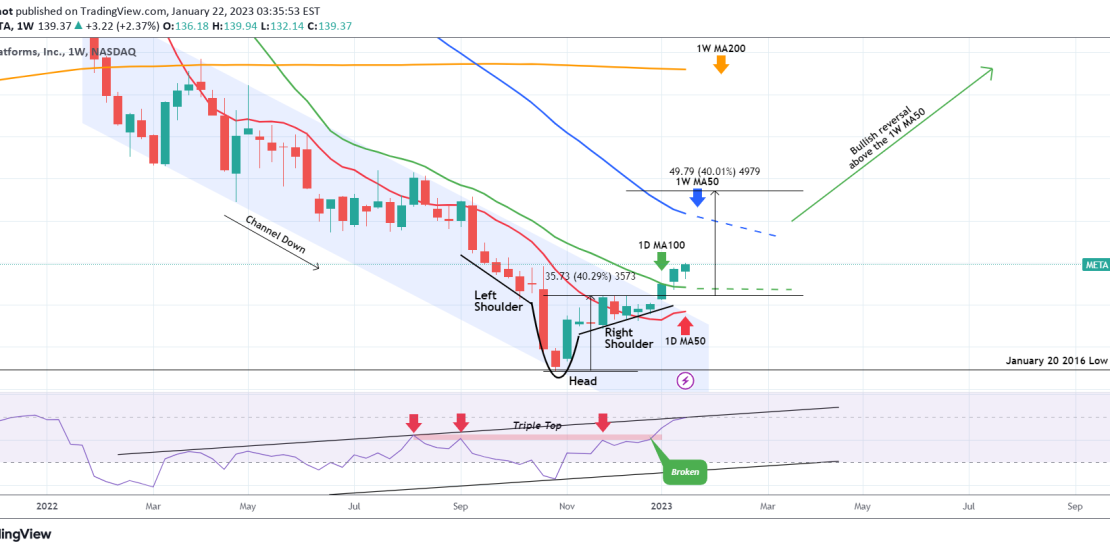
Our update on The Meta Platforms (META) on the 1W time-frame. What stands out is that the stock has completed six (6) straight weekly candles, for the first time since March 2017! This is one of the strongest bullish sequences in its history and while at it, it has established 2 weeks above the 1D
-
NATURAL GAS Astounding multi-year Cycles showing sell’s not over
- January 22, 2023
- Posted by: Tradingshot Articles
- Category: Commodities
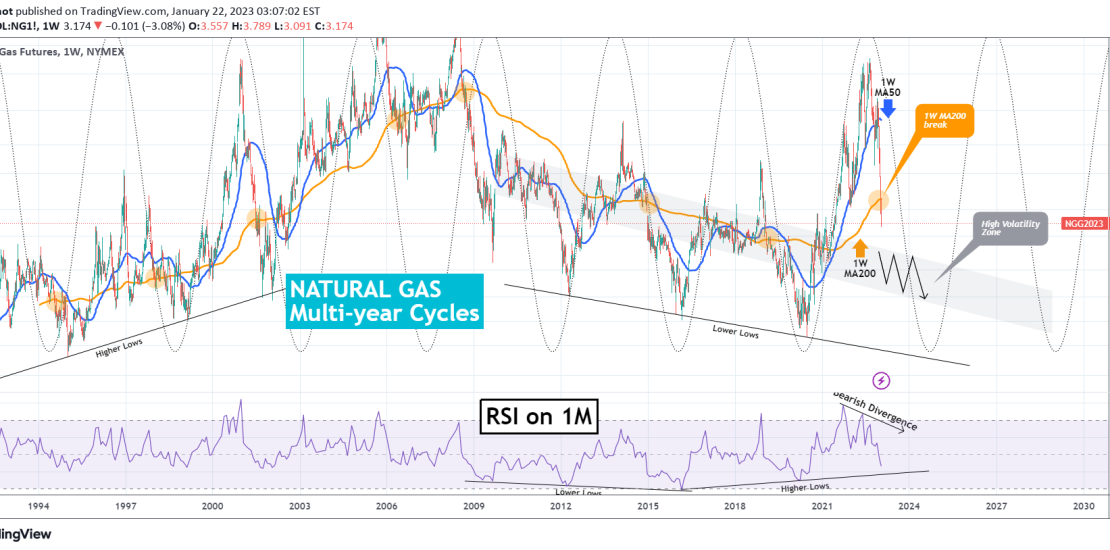
This is not the first time we look into Natural Gas (NG1!) and its long-term patterns. We have coined its Multi-year Cycles Theory in the past and it is time to extend on it a little on the 1W time-frame. Typically investors ask us for 1D analysis such as the following we published 2 months
-
BITCOIN 33k seems inevitable next. This pattern always delivers.
- January 21, 2023
- Posted by: Tradingshot Articles
- Category: Cryptocurrency
We talked yesterday about how beautifully Bitcoin’s (BTCUSD) Adam and Even (A&E) pattern delivered a textbook short-term target at 21650: We looked into such past occurrences more and discovered even more interesting clues for the immediate future. As this analysis shows, every Bear Cycle bottom has been formed on an A&E pattern (even the first
-
DOW JONES The High volatility zone continues to pay off
- January 19, 2023
- Posted by: Tradingshot Articles
- Category: Stock Indices
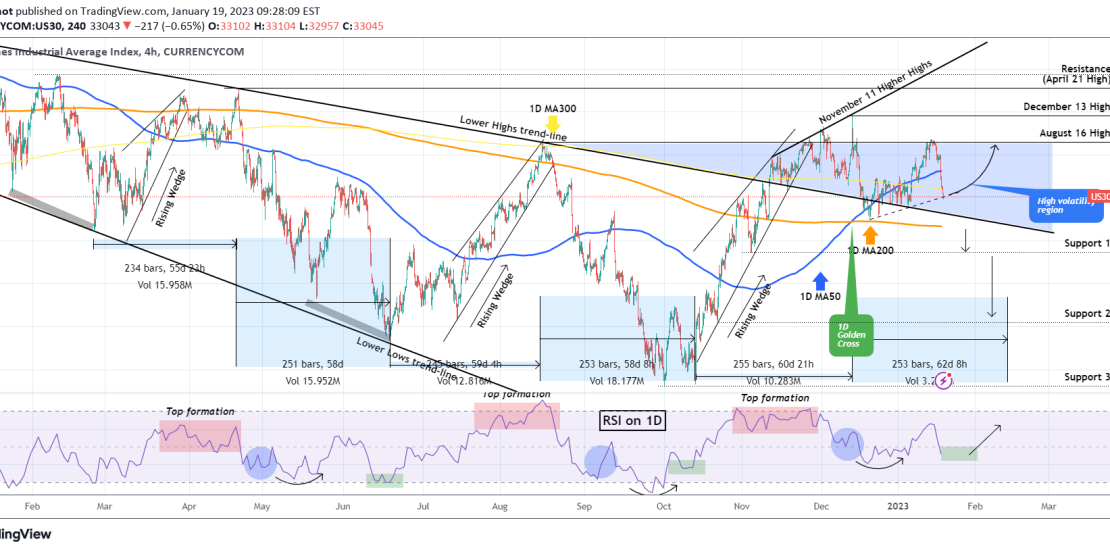
The Dow Jones Industrial Average (DJI) followed our previous call (almost) 3 weeks ago to perfection as after trading within the Triangle, it broke to the upside and hit the 34300 target: The strong rejection of this week simply validates the argument that we’ve made since November, that the blue zone will be a High
-
WTI OIL Limited upside, significant downside
- January 19, 2023
- Posted by: Tradingshot Articles
- Category: Commodities
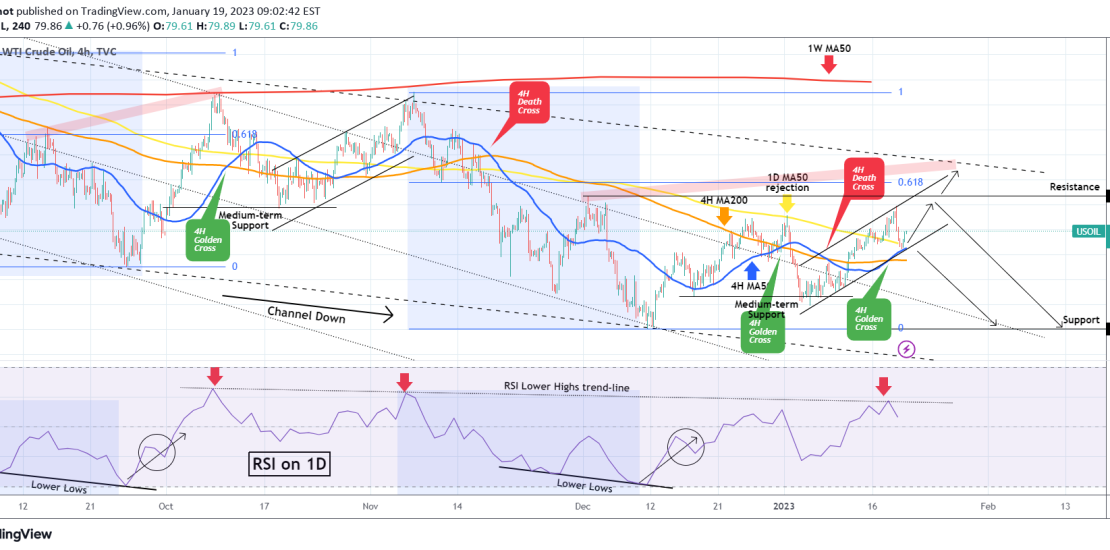
It is time to update our WTI Oil (USOIL) thesis, which was bullish last week as the Resistance within the Channel Up broke: This time we see one last rise as a possibility since the price is rebounding on the 4H MA50 (blue trend-line) but limited to the 83.40 Resistance. An exception can be made
-
BITCOIN The Bollinger Bands delivered when no-one expected!
- January 18, 2023
- Posted by: Tradingshot Articles
- Category: Cryptocurrency
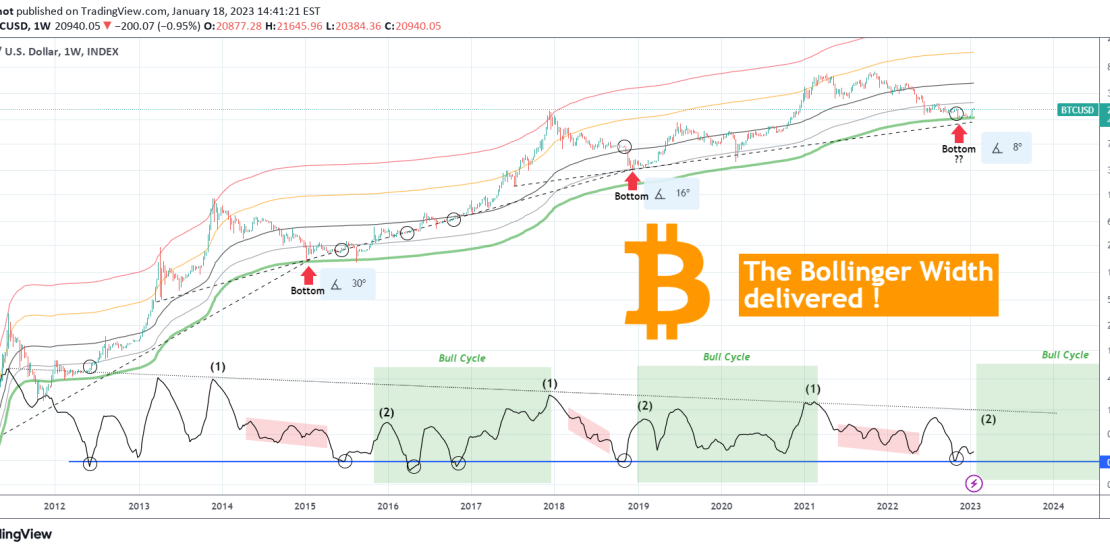
Exactly 2 months ago right after the FTX aftermath, we posted an alternative analysis using a not so popular indicator, the Bollinger Bands Width (BBW): For a broader perspective, that was in combination with the Fib MAs as the MA350 (green trend-line) offered Support. As this held and the BBW rebounded, we mentioned then (which
-
BITCOIN Three mega rally indicators flashing green all at once!
- January 17, 2023
- Posted by: Tradingshot Articles
- Category: Cryptocurrency
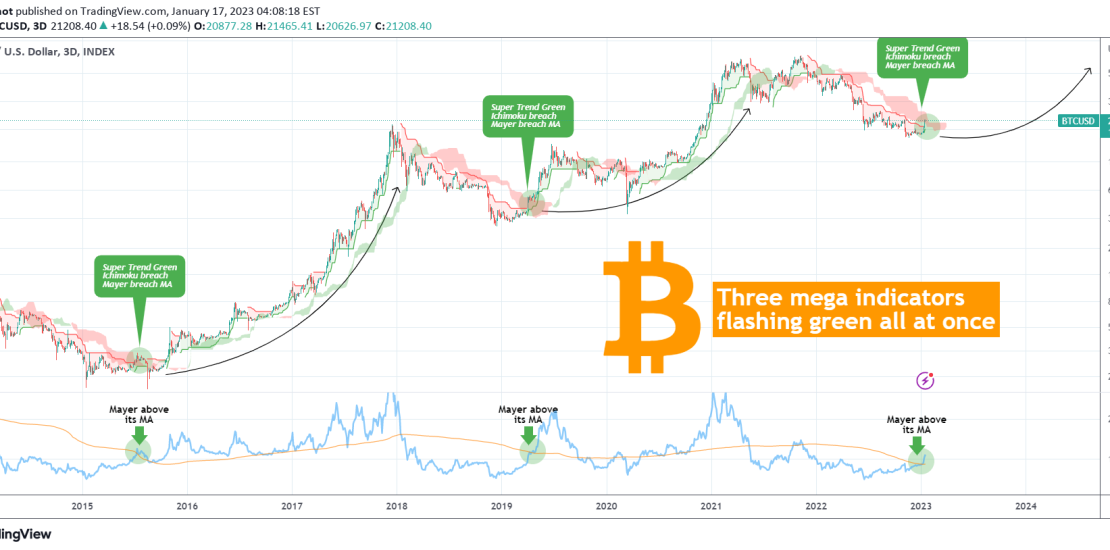
This is not the first time we look at Bitcoin (BTCUSD) on the 3D chart, but it is the first time that three major trend indicators all give a big long-term buy signal at the same time: 1) The Super Trend indicator, which we have used extensively to maintain perspective during the Bear Cycle, just waved
-
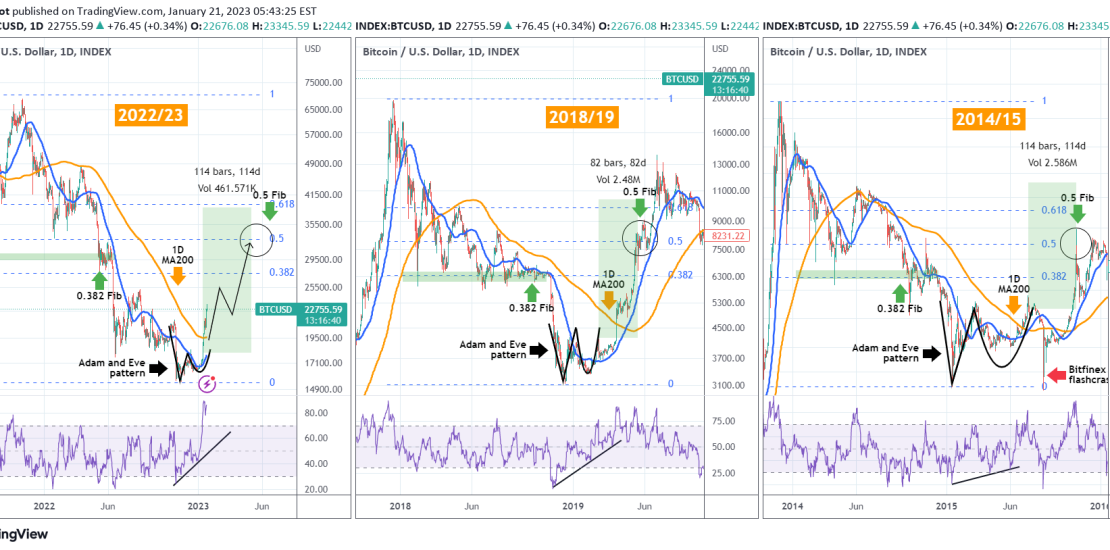
BITCOIN rhymes perfectly with previous Cycle bottoms. 25k next!
- January 16, 2023
- Posted by: Tradingshot Articles
- Category: Cryptocurrency
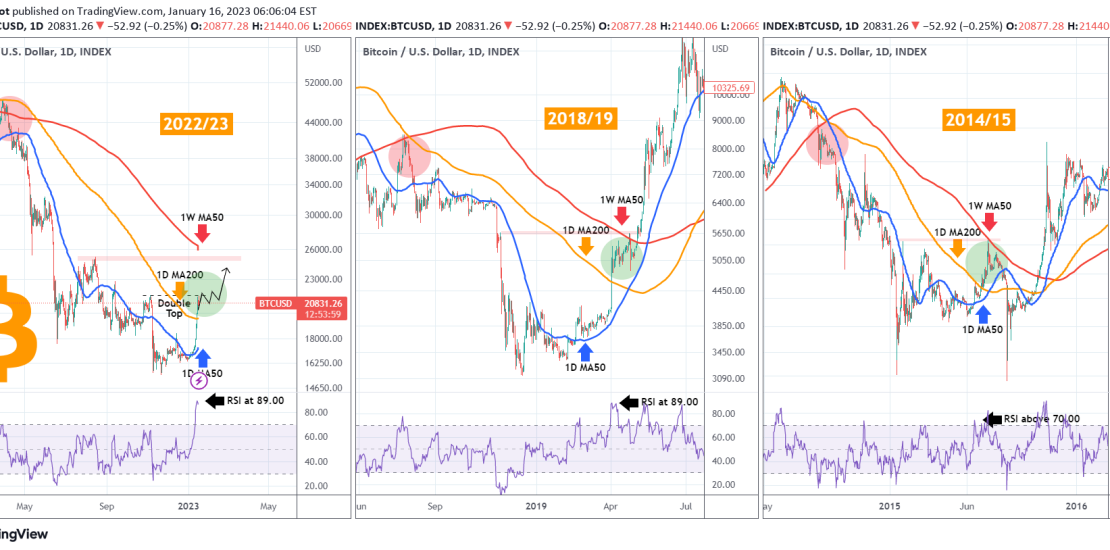
Bitcoin (BTCUSD) on Friday above its 1D MA200 (orange trend-line) for the first time since December 31 2021, which is the level we have rendered all this time as the one that will start the new Bull Cycle. On this analysis on the 1D time-frame, we compare BTC’s current Cycle bottom to those of 2018/19
-
BITCOIN is massively undervalued and here is why.
- January 13, 2023
- Posted by: Tradingshot Articles
- Category: Cryptocurrency
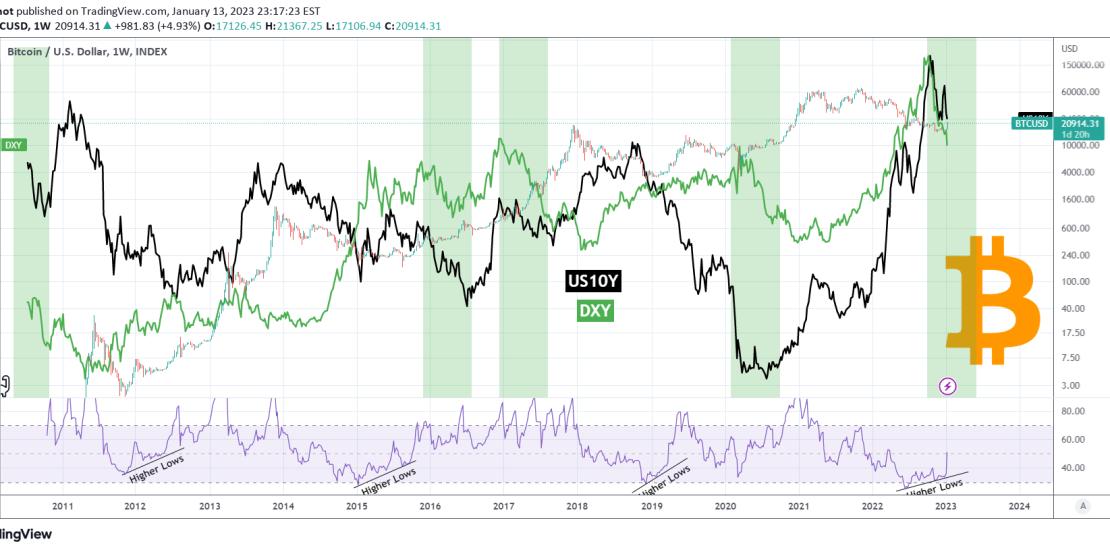
On this 1W time-frame analysis we make a case why Bitcoin (BTCUSD) is massively undervalued in relation to a technical factor as well as the effect that the U.S. 10 Year Government Bonds Yield (US10Y with the black trend-line) and the U.S. Dollar Index (DXY with the green trend-line) have. Bitcoin’s rise this week may