

- January 22, 2023
- Posted by: Tradingshot Articles
- Category: Commodities
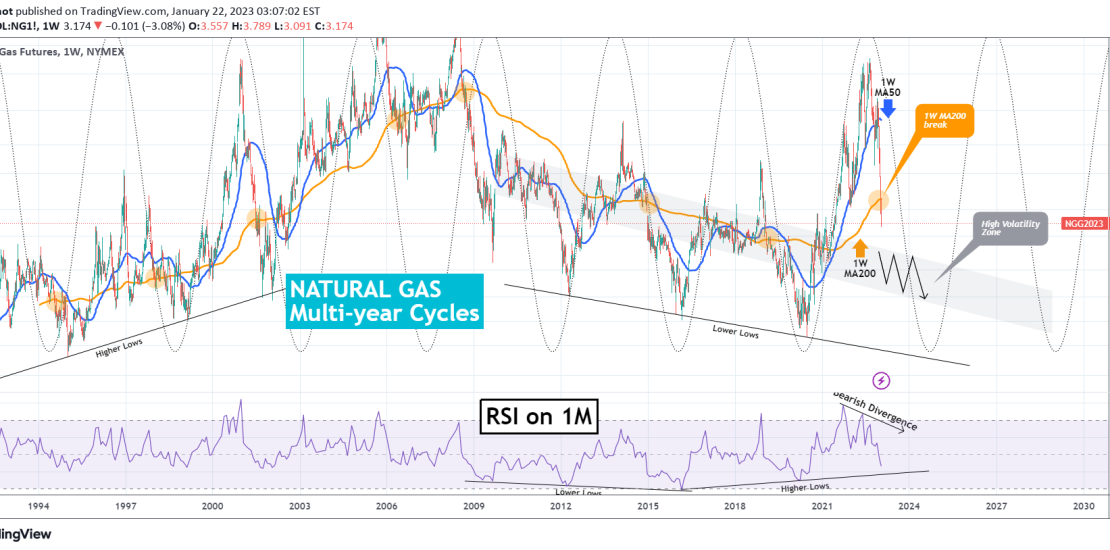
This is not the first time we look into Natural Gas (NG1!) and its long-term patterns. We have coined its Multi-year Cycles Theory in the past and it is time to extend on it a little on the 1W time-frame.
Typically investors ask us for 1D analysis such as the following we published 2 months ago (November 24 2022) and helped us identify the conditions that would fulfil the long-term bearish reversal we expected:

As you see NG delivered the expected drop since it closed below its 1W MA100 and even hit and closed below the 1W MA200 (orange trend-line). Based on this multi-decade blueprint, this is a strong bearish continuation signal. As the chart shows, NG technically makes 4 year Cycles (bottom-to-bottom, top-to-top), which failed only one time in 30 years. Based on this, there is still significant time and range for the price to drop.
The first stop is the (grey) High Volatility Zone, where the price typically trades for a longer-than-usual period of time. We need to keep an eye on the RSI on the 1M time-frame and its Higher Lows trend-line. If its holds, expect a bounce, in a similar fashion as the Lower Highs from May 2009 to February 2016. If they break, we expect first the 1.600 level to be tested as a Support and potentially under conditions (which we will analyze extensively if this time comes), the prices Lower Lows trend-line.
Keep in mind that the RSI is always helpful and in recent months in particular, as its Bearish Divergence on Lower Highs (against the price’s Higher Highs) from September 2021 to August 2022 projected the peak.
Tradingview link: