

- January 16, 2023
- Posted by: Tradingshot Articles
- Category: Cryptocurrency
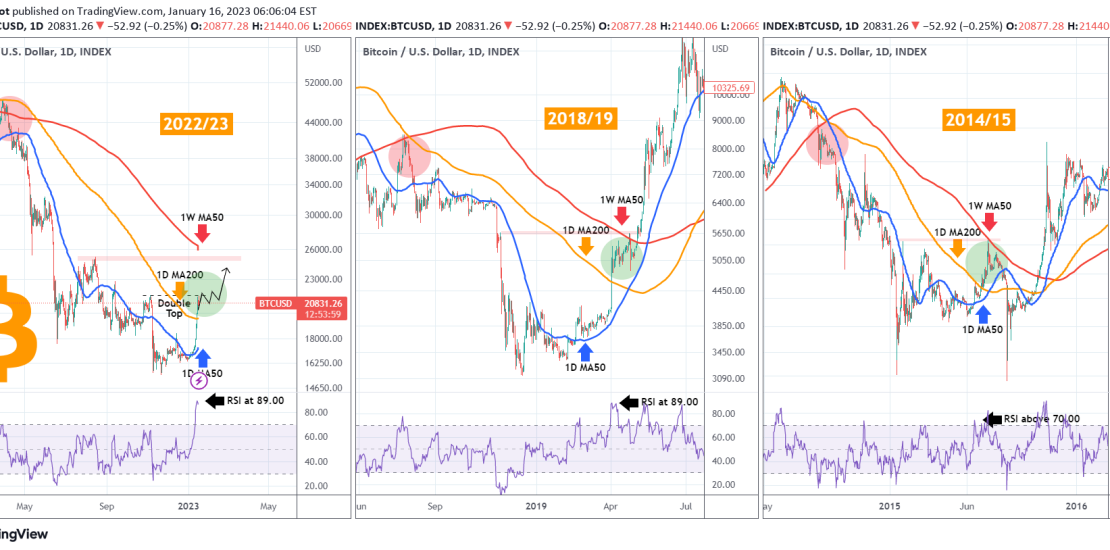
Bitcoin (BTCUSD) on Friday above its 1D MA200 (orange trend-line) for the first time since December 31 2021, which is the level we have rendered all this time as the one that will start the new Bull Cycle. On this analysis on the 1D time-frame, we compare BTC’s current Cycle bottom to those of 2018/19 and 2014/15.
As you see, during those Bottoms, when the price broke above the 1D MA200, it quickly hit the 1W MA50 (red trend-line) within 3-4 weeks, always having the 1D MA50 (blue trend-line) as Support. On the April 02 2019 1D MA200 break-out in particular, the 1D RSI hit the 89.00 level before retracing, just as it did today. These RSI retracements don’t indicate trend reversals, just a re-balancing of the enormous buying pressure.
It is interesting to add that on both previous bottoms, the 1W MA50 was hit on a Resistance level (red zone) made by a previous Lower High during the Bear Cycle. This time the strongest candidate for this level appears to be 25300 (August 15 2022 Lower High).
What could happen after that? Well, as long as the 1D MA50 supports, Bitcoin can continue the rally past the 1W MA50, as it happened in May-June 2019. A break below the 1D MA50 though, could deliver one last major pull-back to the 19k-20k or even 17k supply zones, similar to what happened on August 2015.
Feel free to let me know in the comments section below!
Tradingview link: