

- January 11, 2022
- Posted by: Tradingshot Articles
- Category: Commodities
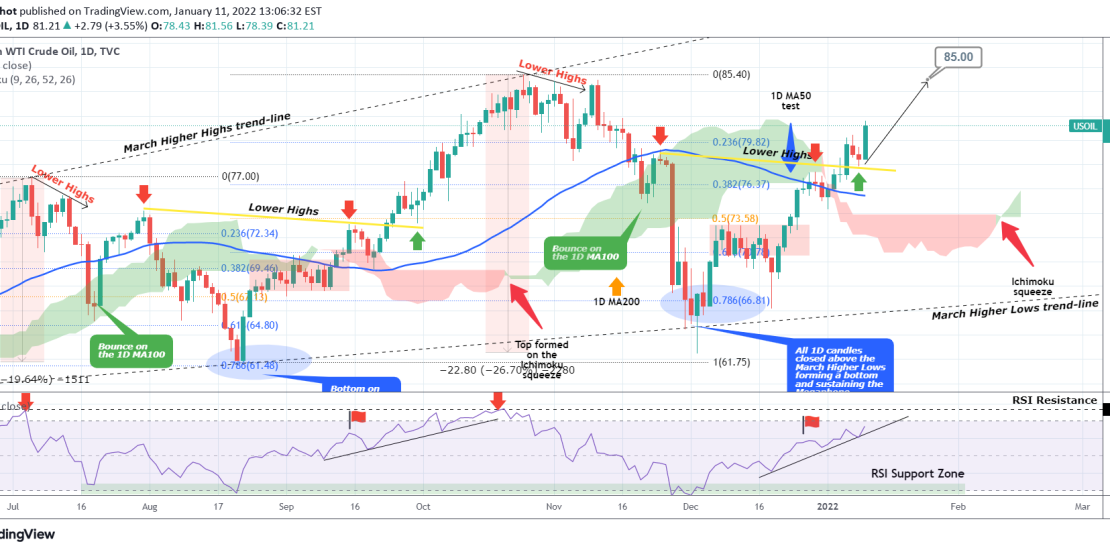
We have been following this bullish sequence on WTI Oil closely since the December 02 2021 bottom and so far is following our projection to a great extent:


As you see, the most recent pull-back (red arrow) was successfully made on the yellow Lower Highs trend-line and after the price recovered, it re-tested (green arrow) the line as a Support, which is so far giving a very strong green 1D candle today. As explained on my previous analyses, this is following the late August – late October bullish wave sequence to the Higher Highs trend-line of the long-term pattern.
You don’t need to target all the way to the Higher Highs trend-line, the previous high of $85.00 is good enough to take profit as we’ve been mentioning since December. However if you wish to seek more risk, an potential indicator that may signal the next top, is the Ichimoku Cloud. During the last bullish wave of August – October, the market top was formed exactly on the Ichimoku squeeze. Currently the new squeeze is on February 10. Can this mean that we still have another month of uptrend? Possibly but always manage the risk carefully especially in the energy sector.
Tradingview link:
https://www.tradingview.com/chart/USOIL/Gei9T5Ap-WTI-OIL-is-on-track-for-the-October-85-00-high