2022 December
-
BITCOIN & the USDT Dominance point to a fast reversal!
- December 1, 2022
- Posted by: Tradingshot Articles
- Category: Cryptocurrency
No Comments
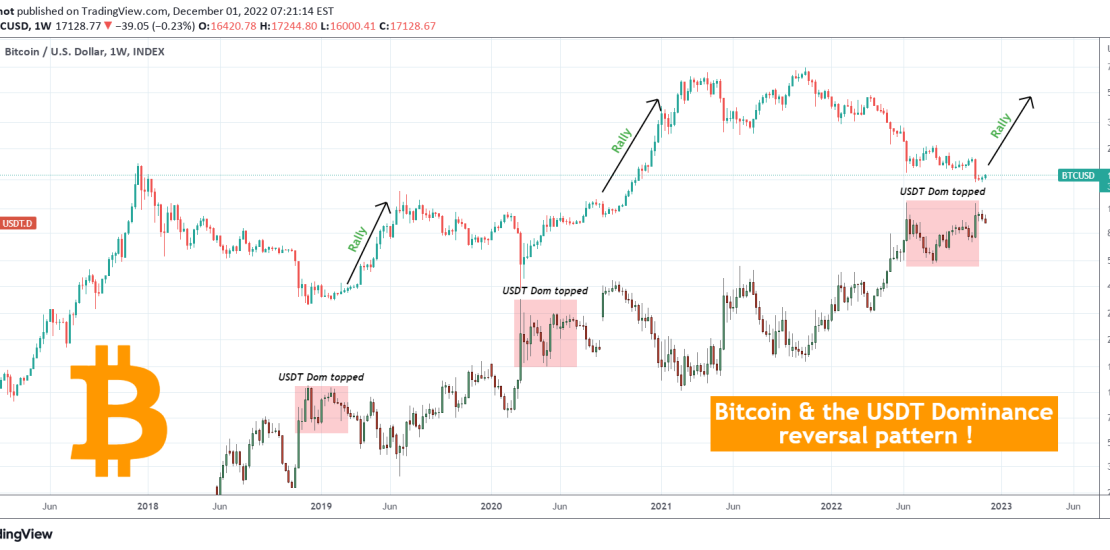
This is Bitcoin (BTCUSD) on the 1W time-frame drawn against the USDT dominance. For better comparison purposes both are displayed in candle bars, BTC being on top, USDT Dom at the bottom. The essence of this comparison is to find a behavioral pattern that can help us estimate which phase of the Cycle BTC
-
US02Y is the key for stocks and it has started to drop!
- December 1, 2022
- Posted by: Tradingshot Articles
- Category: Other

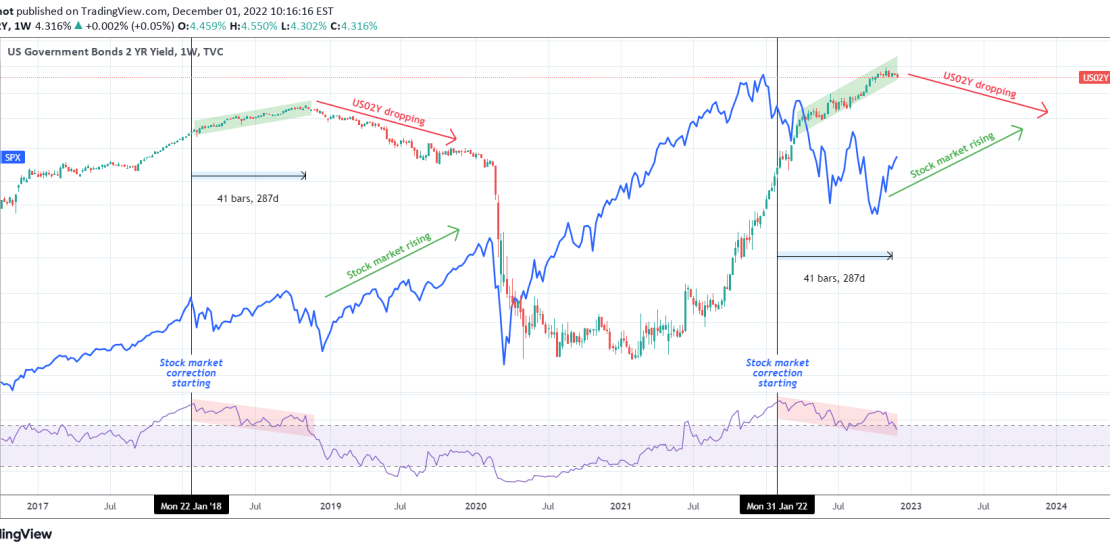
This is a 1W time-frame chart, showing the correlation between the U.S. Government Bonds 2 YR Yield and the S&P500 (blue trend-line). Some may perceive the recent 2-month rally on stocks as a coincidence but the US02Y price action shows that it is not and has a direct correlation with it. The 1W RSI
-
S&P500 What crisis? We’re still in a cyclical Bull.
- December 1, 2022
- Posted by: Tradingshot Articles
- Category: Stock Indices

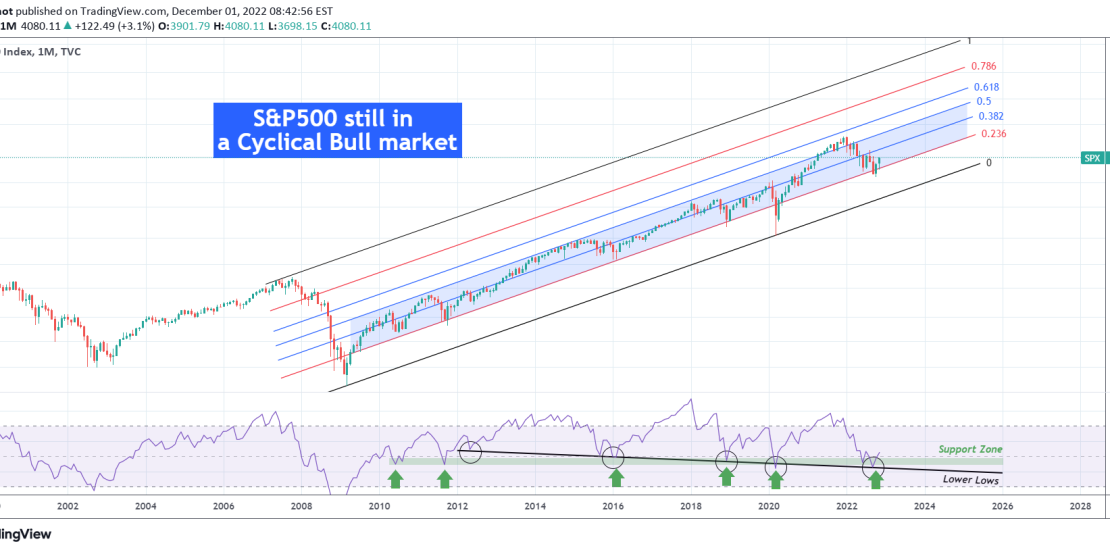
This is the S&P500 index (SPX) on the 1M (monthly) time-frame illustrating key levels and zones using the Fibonacci Channel. We focus on the price action and pattern created following the last major crisis, the 2008 housing crash. As you see, since that Bear Cycle correction, S&P500 has been trading within a steady Channel

