

- December 22, 2022
- Posted by: Tradingshot Articles
- Category: Cryptocurrency
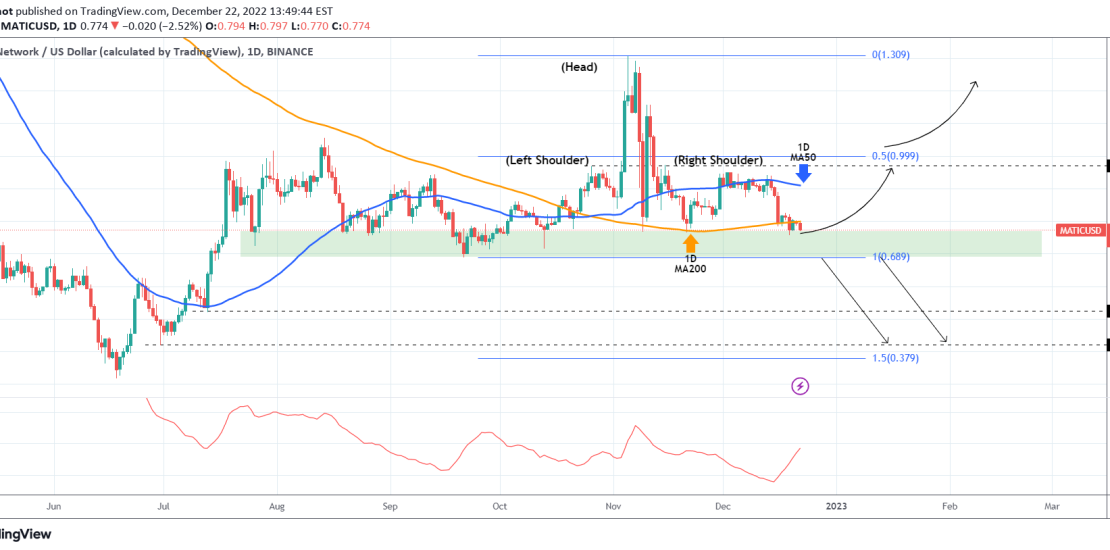
The Matic Network (MATICUSD) recently established trading below its 1D MA200 (orange trend-line), closing a daily candle below it for the first time since October 20. This alone is far from ideal for buyers but the price remains within the wide 0.690 – 0.770 Support Zone that is holding since July 26.
However, we can’t ignore the Head and Shoulders pattern since October 13 that has just been completed. If broken to the downside, this has the potential to drop as low as the 1.5 Fibonacci extension, which is at 0.380 with potential Support levels before that at 0.525 and 0.420.
Until the Green Zone breaks though, the price can potentially rebound back to the 1D MA50 (blue trend-line) and the 0.970 overhead Resistance. The 1D ADX indicator seems to be in agreement. A closing above the 0.5 Fib at 1.000, invalidates the Head and Shoulders pattern completely and recovers the price towards 1.300.
Tradingview link: