

- December 20, 2022
- Posted by: Tradingshot Articles
- Category: Commodities
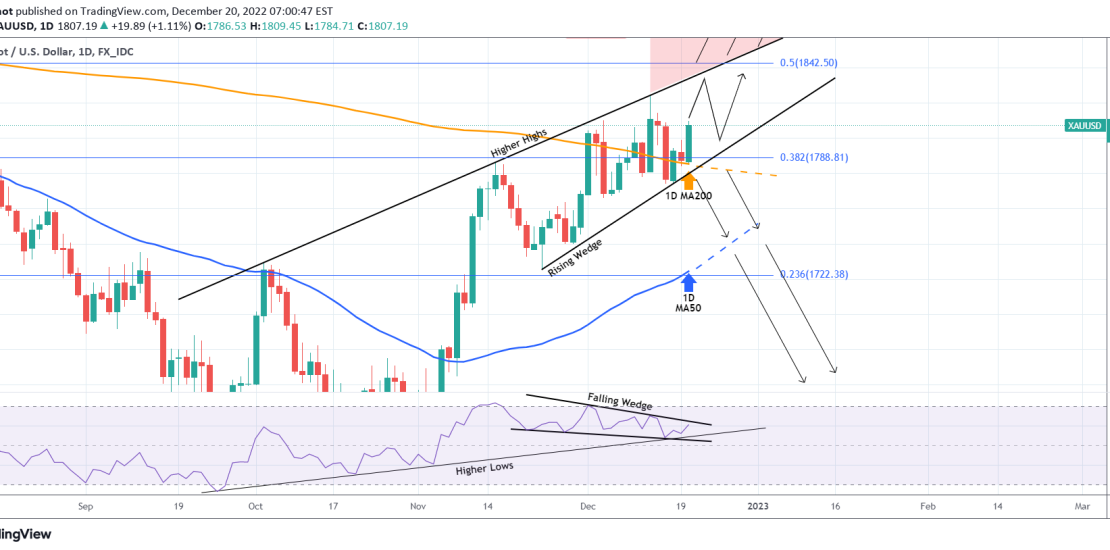
Gold (XAUUSD) is rising today supported by the 1D MA200 (orange trend-line). The pattern is so far a Rising Wedge since the November 15 High and the next Higher High limit is currently at 1835.
At the same time, the 1D RSI has been within a Falling Wedge, indicating a Bearish Divergence. Though this is not a long-term sell signal, it certainly shows the potential of a technical pull-back to the 1D MA50 (blue trend-line), which Gold hasn’t had since the November rally started. The RSI though remains supported on a Higher Highs trend-line that started on the September 26 Low (and was what helped us predict the November rally), so as long as it does it remains short-term bullish.
As a result, we remain bullish as long as the price trades within the Rising Wedge, targeting 1834, but a break below it (also the 1D MA200) will be a short-term bearish signal for us towards the 1D MA50.
Tradingview link:
https://www.tradingview.com/chart/XAUUSD/EU949Lar-XAUUSD-Be-careful-with-this-RSI-Bearish-Divergence