

2021
-
GBPJPY Major Resistance from 2007!
- August 12, 2021
- Posted by: Tradingshot Articles
- Category: Forex
No Comments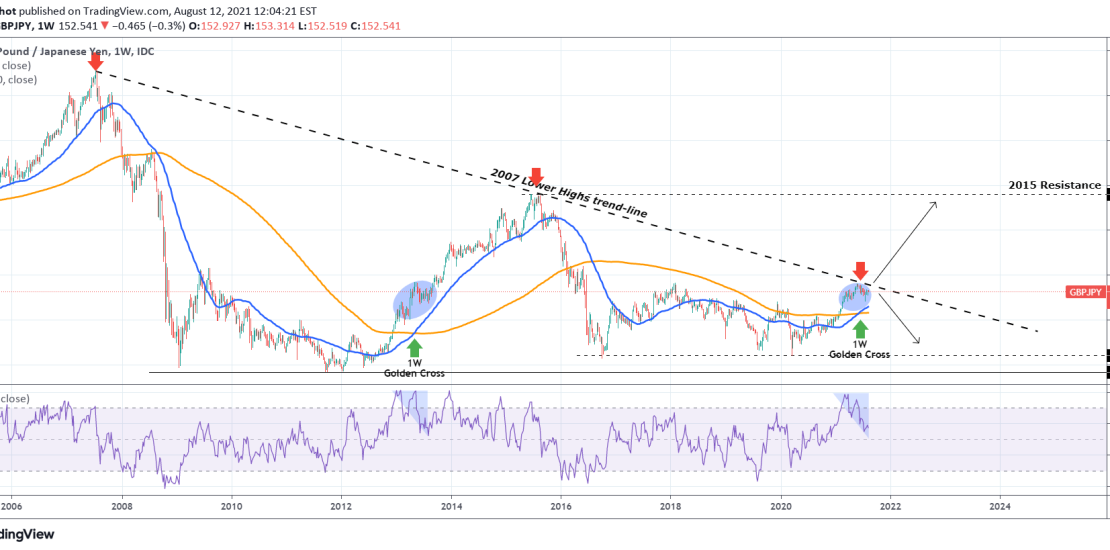
GBPJPY is ahead of a “Make or break” situation as it is facing the Lower Highs trend-line that started all the way back from the 2007 subprime mortgage crisis. As long as it holds, the pair will most likely reverse back towards the lower Support levels. However if the 2007 line breaks, then it
-
FTSE 2017 fractal points to a 7500 top
- August 12, 2021
- Posted by: Tradingshot Articles
- Category: Stock Indices
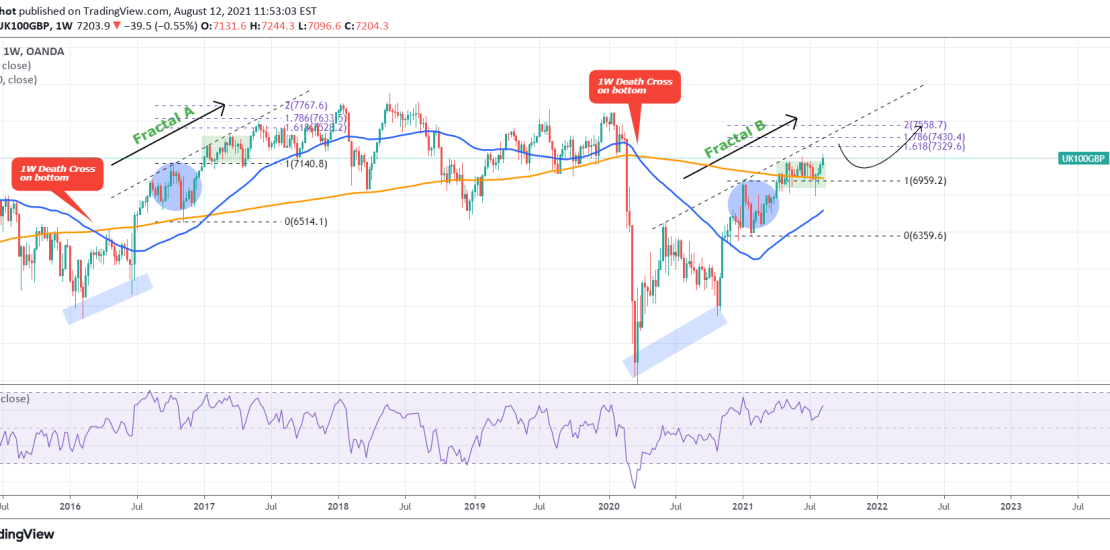
This is a fractal analysis on FTSE from 2017. Not much description is needed here, the chart is quite straightforward. The 2020-2021 (Fractal B) price action so far is similar to the 2016-2017 (Fractal A) sequence. They both started after the market bottomed out on a 1W Death Cross and have been rising with
-
EURUSD hit the 4H Lower Lows trend-line
- August 11, 2021
- Posted by: Tradingshot Articles
- Category: Forex
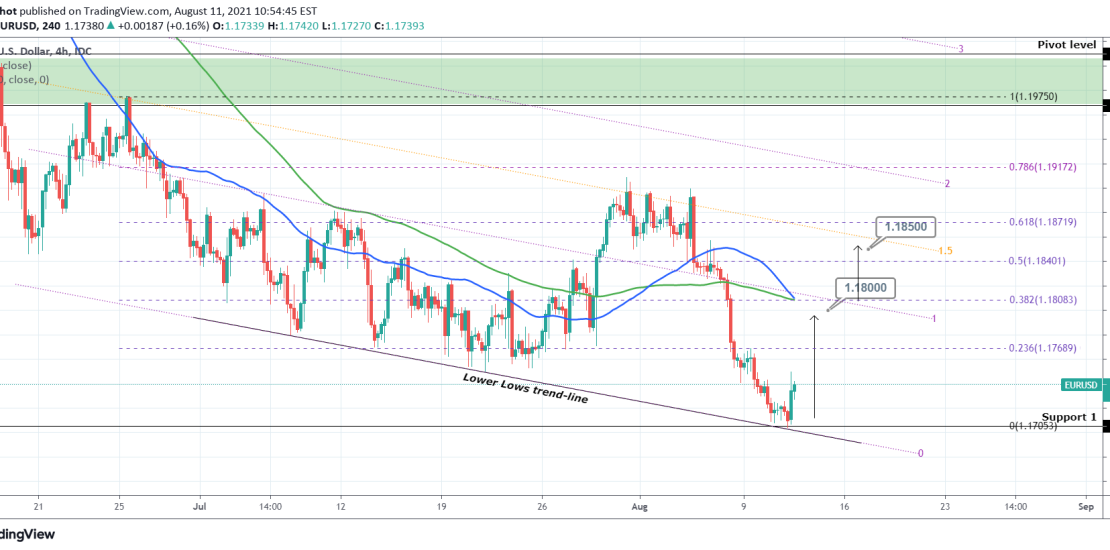
Pattern: Bearish Fibonacci Channel on 4H. Signal: Buy as the price hit the Lower Lows trend-line of the Channel which within July has always initiated a rebound towards at least the 4H MA50 (blue trend-line). Target: 1.1800 short-term (right below the Channel’s 1.0 Fib and the horizontal 0.382 Fib retracement) and 1.18500 medium-term (right
-
XAUUSD Bullish divergence and Inverse H&S lead to break-out
- August 11, 2021
- Posted by: Tradingshot Articles
- Category: Commodities
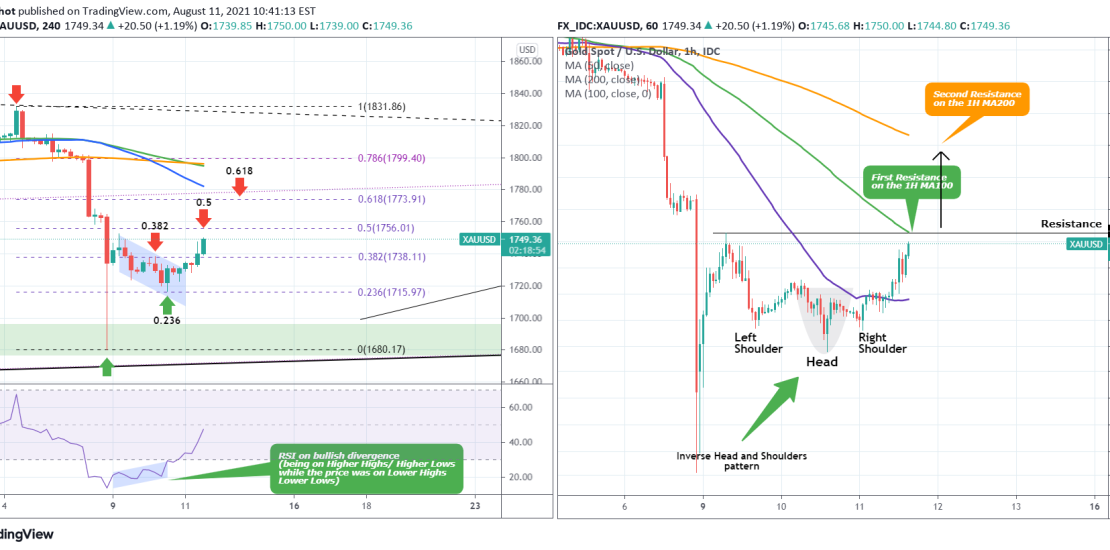
This is a short-term update to my recent long-term idea: As you see on the left chart, Gold broke above the Channel Down and the early signal to this break-out was the 4H RSI which was you see was on a Bullish Divergence as while the price was in a Channel Down, the RSI
-
XAGUSD Multi-decade Cup & Handle?
- August 9, 2021
- Posted by: Tradingshot Articles
- Category: Commodities
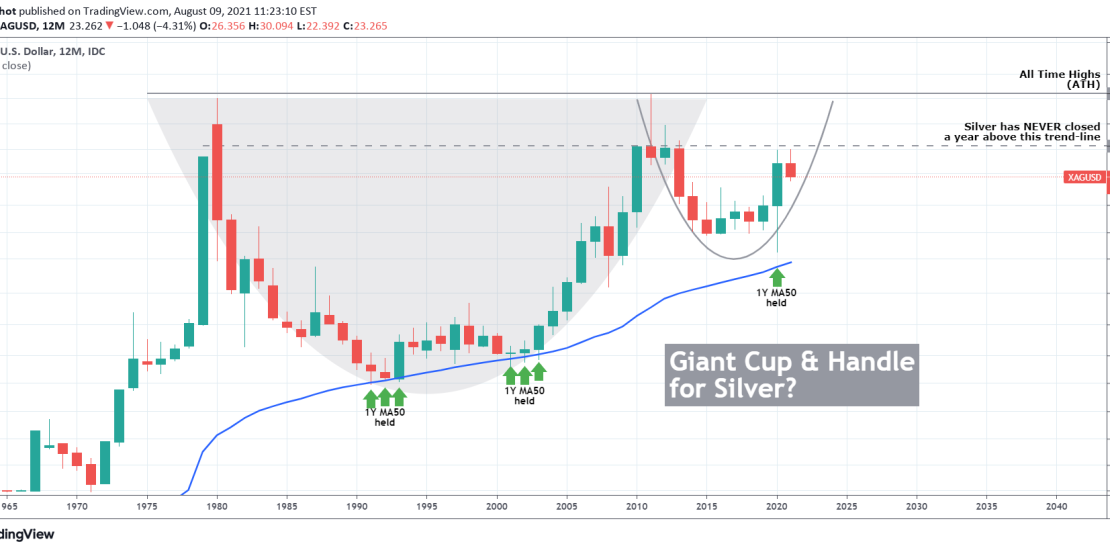
Silver pulled back on Friday and today along with most major commodities due to the USD showing strength on the incredible Nonfarm Payrolls numbers. All this short-term price action though can be viewed as nothing but noise on one pattern that has been developing since 1980 and may be close to completion. I am
-
XAUUSD is approaching the 2018 bullish trend-line.
- August 9, 2021
- Posted by: Tradingshot Articles
- Category: Commodities
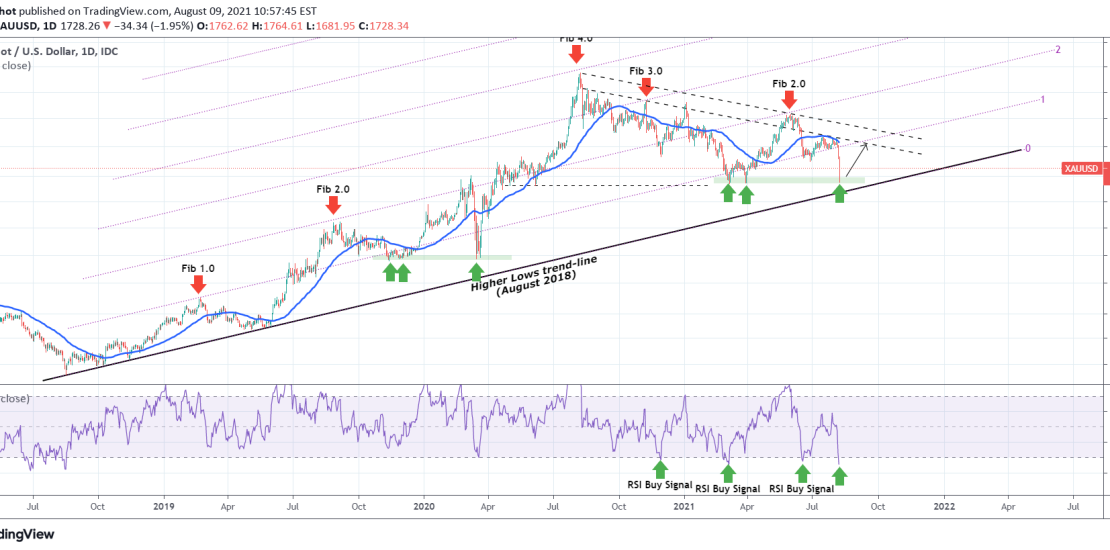
The Nonfarm Payrolls (much) better than expected numbers delivered a major blow to Gold last Friday, which was extended today into one of the most violent daily sessions of the past 2 years (along with August 12 2020 and March 16 2020), that reached the March 2021 lows, which currently acts as the Support
-
BITCOIN is testing the 1D MA200, key to continue the Bull Cycle.
- August 7, 2021
- Posted by: Tradingshot Articles
- Category: Cryptocurrency
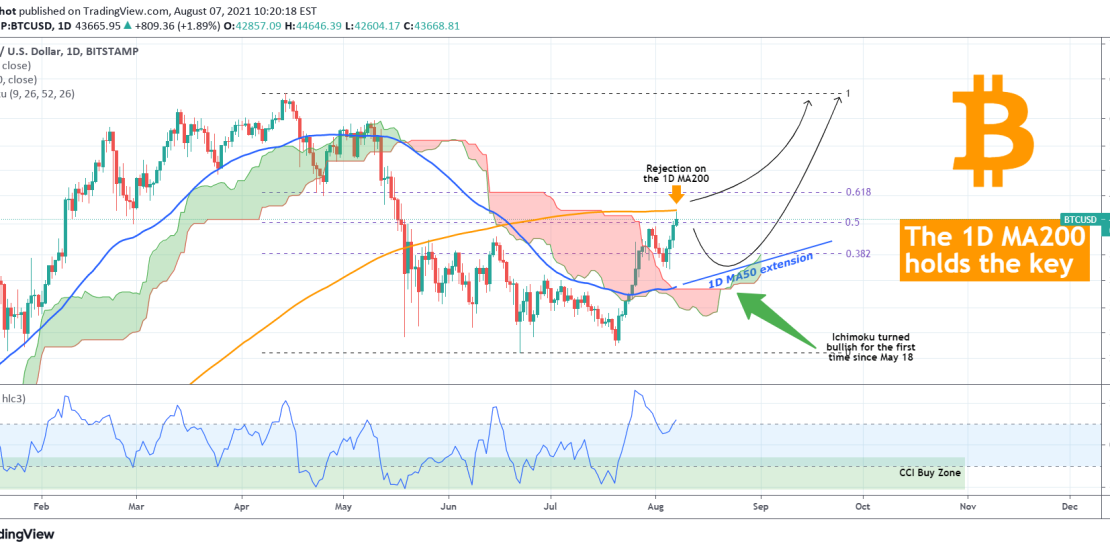
Not that long ago, on July 21, when Bitcoin hit its two month Support Zone of 29000 – 30100 and Triple Bottomed, I posted the following analysis indicating that the Target was the 1D MA200 (orange trend-line): Well today the price finally reached that level after 72 days (first time since May 26), and
-
BITCOIN 2nd straight green week and 1st green month since March!
- August 3, 2021
- Posted by: Tradingshot Articles
- Category: Cryptocurrency
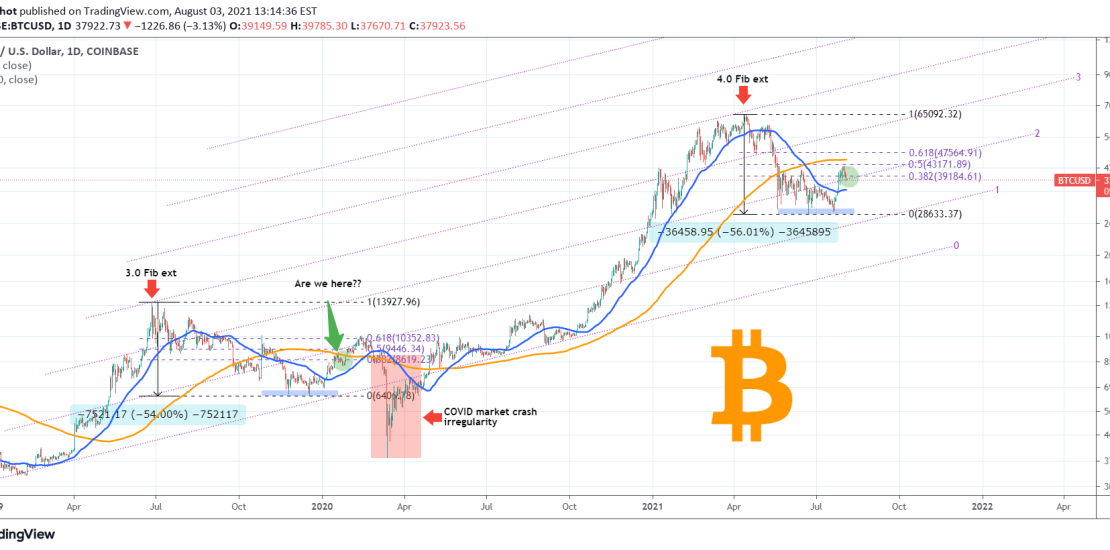
What do the above candle closings on the weekly and monthly time-frames tell us? In my opinion quite a lot of information. The weekly (1W) closing came after holding the 1W MA50 which has been the Support for over 1 year now (since late April 2020) after Bitcoin recovered from the COVID March 2020
-
XAUUSD Sideways until one of those lines breaks
- August 2, 2021
- Posted by: Tradingshot Articles
- Category: Commodities
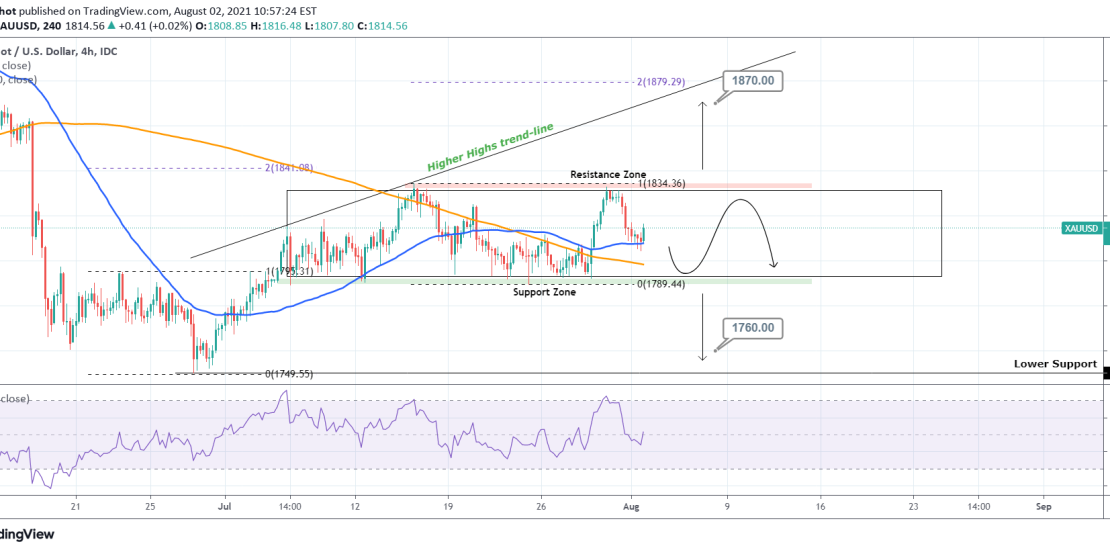
Pattern: Rectangle on 4H. Signal: Scalping as long as the Resistance and Support zones break. (A) Buy if the Resistance breaks, (B) Sell if the Support breaks. Target: (A) 1870 (just below the 2.0 Fibonacci extension), (B) 1760 (just above the 1750 1D Support). Tradingview link: https://www.tradingview.com/chart/XAUUSD/FE4dVAoe-XAUUSD-Sideways-until-one-of-those-lines-breaks
-
BITCOIN Golden Cross fractal potentially point to 49k and 59k
- July 31, 2021
- Posted by: Tradingshot Articles
- Category: Cryptocurrency
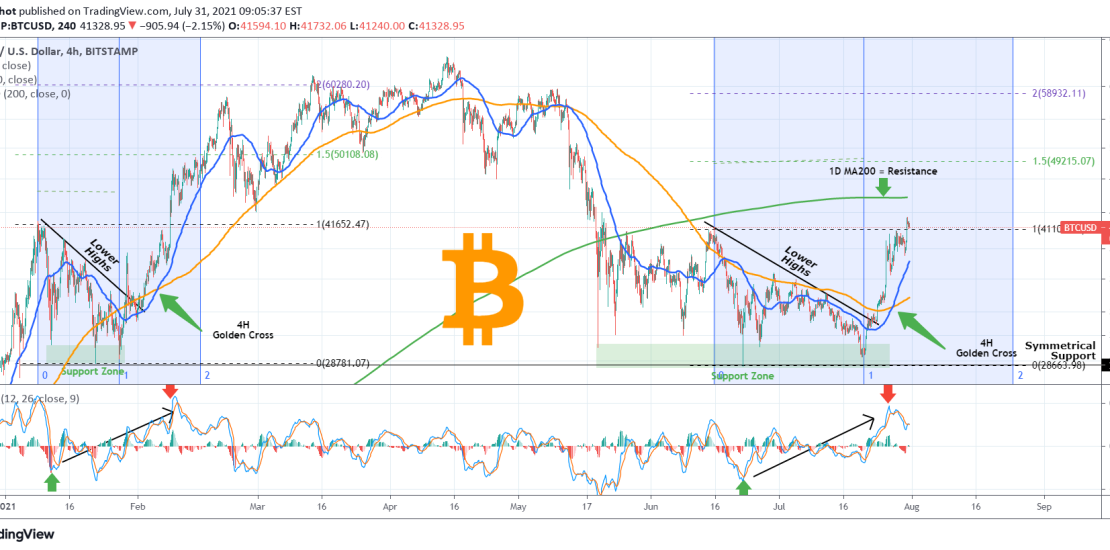
With all of Bitcoin’s aggressive rise last week, a formation that went unnoticed by many was the Golden Cross (when the MA50 crosses above the MA200) on the 4H time-frame. And quite deservedly as the last 4H Golden Cross on June 17 failed to deliver a rise. The current one however managed to overcome