

- January 14, 2021
- Posted by: Tradingshot Articles
- Category: Uncategorized
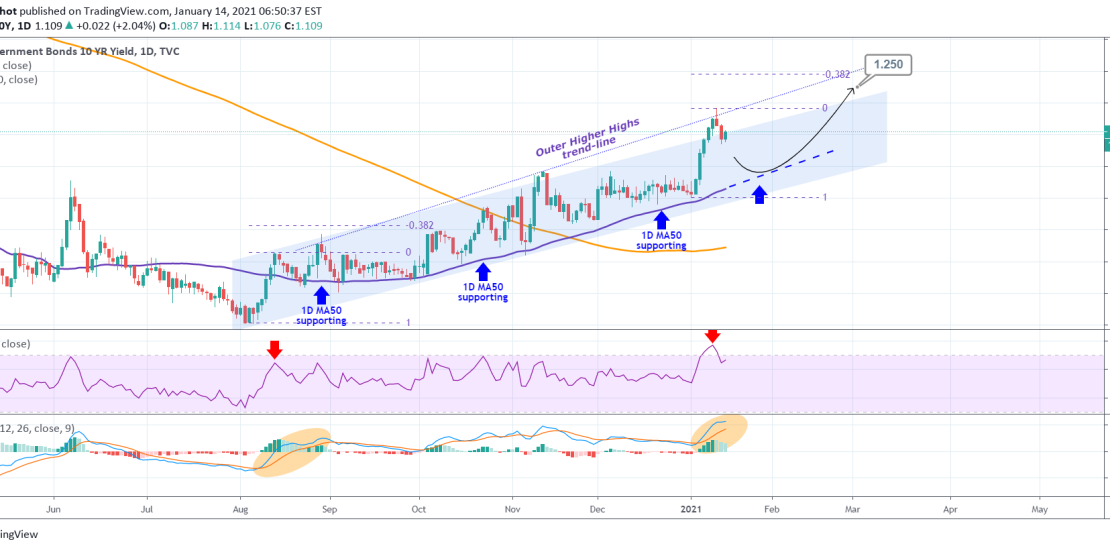
Pattern: Channel Up on 1D.
Signal: Buy once the price approaches the 1D MA50 (blue trend-line) which has been the most consistent buy entry since mid August. Also based on both the 1D RSI and MACD, the August leg is currently repeated.
Target: 1.250 (just under the Outer Higher Highs trend-line and the 0.382 Fibonacci extension).
** Please support this idea with your likes and comments, it is the best way to keep it relevant and support me. **
——————————————————————————————————–
!! Donations via TradingView coins also help me a great deal at posting more free trading content and signals here !!
🎉 👍 Shout-out to TradingShot’s 💰 top TradingView Coin donor 💰 this week ==> ProjectSyndicate
——————————————————————————————————–
Tradingview link:
https://www.tradingview.com/chart/US10Y/W9X1G4iE-US10Y-Bullish-structure-on-the-10-year-Bond-yields