

- January 14, 2021
- Posted by: Tradingshot Articles
- Category: Forex
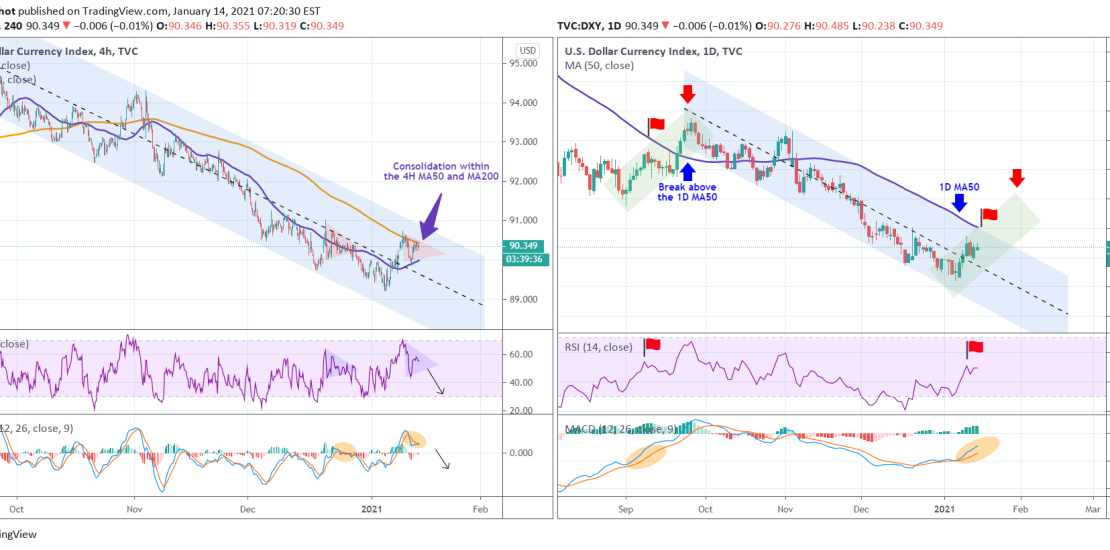
The U.S. Dollar index is consolidating for the past 2 days within the MA50 and MA200 on the 4H time-frame (chart on the left). The RSI is indicating that such consolidating, within a Triangle pattern, is similar to the December 22-25 sequence, which after it broke ended lower with a new Lower Low on the long-term Channel Down pattern that DXY is in since late September.
On the 1D time-frame though (chart on the right), both the RSI and MACD indicators show that we could be repeating the September rise (which eventually led to the start of the Channel Down). Currently the 1D MA50 is the Resistance, but on the September rise it broke and peaked a few days later.
All the above suggest the DXY is still a sell but traders should reserve an additional sell for a potential peak near 92.000. Which pattern do you think will prevail?
Most recent DXY signal:

** Please support this idea with your likes and comments, it is the best way to keep it relevant and support me. **
——————————————————————————————————–
!! Donations via TradingView coins also help me a great deal at posting more free trading content and signals here !!
🎉 👍 Shout-out to TradingShot’s 💰 top TradingView Coin donor 💰 this week ==> ProjectSyndicate
Tradingview link:
https://www.tradingview.com/chart/DXY/VN4h5elM-DXY-conflicting-patterns-on-the-4H-and-1D-time-frames