- January 21, 2021
- Posted by: Tradingshot Articles
- Category: Cryptocurrency

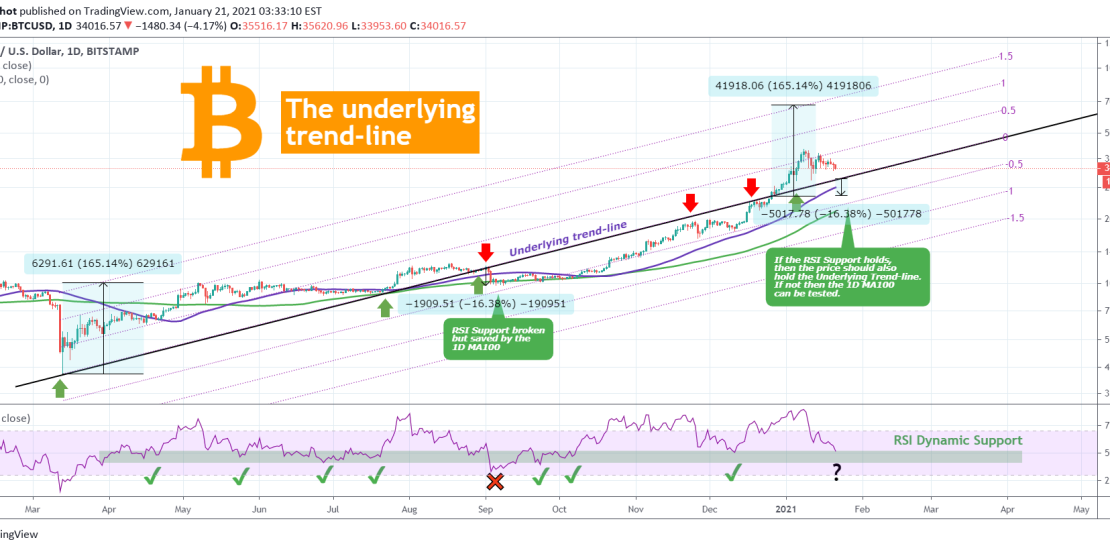
Do you remember this trend-line I posted back in June, 2020? Well it is time we have a new look at it as it is closed to being tested again.
** The underlying trend-line **
As you see this is the dominant trend-line since the March 2020 bottom that was caused by the massive asset-wide liquidation due to the COVID pandemic. The trend-line has been holding as Support since August 2020 and after breaking to the downside, Bitcoin stayed under it until December 26, 2020. Therefore, even though not equal, BTC has spend a respectable amount of time both above and below the trend-line. However it’s only been less than 1 month that it broke again above it.
** The RSI **
The RSI on the 1D time-frame is currently testing its Dynamic Support Zone. This Zone has been holding since late March 2020, having broken only once (September 03, 2020). As a result it is naturally one of the strongest Support levels on the long-term. When it broke, the price broke also below the Underlying trend-line, but found Support on the 1D MA100 (green trend-line), which is an MA period the importance of which, I have extensively analyzed on previous studies.
So with the above parameters in mind, it appears that the Underlying trend-line has more probabilities to hold than to break. Especially as long as the RSI Dynamic Support holds. If that breaks, BTCUSD can still meet its final Support trend-line on the 1D MA100, which based on its current projection can make contact with around $25000. That will make roughly a -40% correction from the recent top, which as I’ve shown in a previous analysis, has also happened during Bitcoin’s previous Parabolic Bull Run in 2017.
That also matches the potential of a -16% drop below the Underlying trend-line, which was the % decline of the last time (August 2020) that the price broke below it. Notice also that the potential bullish extension when BTC is trading above the Underlying trend-line is +165%, which was registered from the March 13, 2020 Bottom until the May 07, 2020 High. A repeat of the maximum potential from the December 26, 2020 break-out would place the High around $66000.
But what do you think? Will the Underlying trend-line hold or break? And if so, can the 1D MA100 save the day again? Feel free to share your work and let me know in the comments section!
Please like, subscribe and share your ideas and charts with the community!
——————————————————————————————————–
!! Donations via TradingView coins also help me a great deal at posting more free trading content and signals here !!
🎉 👍 Shout-out to TradingShot’s 💰 top TradingView Coin donor 💰 this week ==> gunhesss
Tradingview link:
https://www.tradingview.com/chart/BTCUSD/TTlXv4F2-BITCOIN-It-s-the-underlying-trend-line-again

