

- January 26, 2021
- Posted by: Tradingshot Articles
- Category: Cryptocurrency
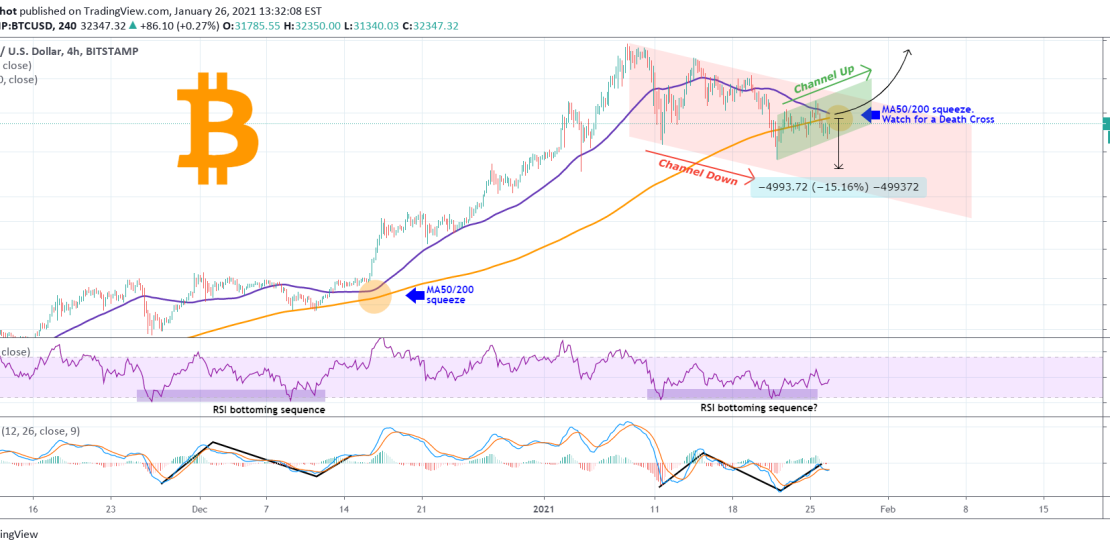
Bitcoin remains under pressure since the January 08 High, with its main pattern being a Channel Down.
On the 4H chart, the RSI and LMACD indicators have formed sequences similar to the mid November – mid December 2020 consolidation phase. As you see on the chart those are bottoming patterns formed within a short-term accumulation phase. The new bullish wave after this accumulation phase came once the 4H MA50 (blue trend-line) and MA200 (orange trend-line) converged so much but without making contact. At the moment those two are close to making contact.
* If they don’t make contact then, based on this bottoming sequence, we may see a new aggressive bullish wave. We already see a small Channel Up forming (within the Channel Down), which is encouraging.
* If they cross though, they will form a Death Cross, and that will the first time we’ll be seeing one since August 29th. As ou see on the chart below that wasn’t the end of the world, but was it did deliver a -15% pull-back and took BTCUSD 50 days to recover the price at the time of the Death Cross. From the current level of the 4H MA200, a -15% pull-back would put BTC around $28000.
Which scenario do you think will prevail? Feel free to share your work and let me know in the comments section!
Please like, subscribe and share your ideas and charts with the community!
——————————————————————————————————–
!! Donations via TradingView coins also help me a great deal at posting more free trading content and signals here !!
🎉 👍 Shout-out to TradingShot’s 💰 top TradingView Coin donor 💰 this week ==> TradingView
——————————————————————————————————–
Tradingview link:
https://www.tradingview.com/chart/BTCUSD/Kn3WkaBu-BITCOIN-Watch-out-for-that-4H-Death-Cross