

-
S&P500 is approaching its medium-term buy level
- November 30, 2021
- Posted by: Tradingshot Articles
- Category: Stock Indices
No Comments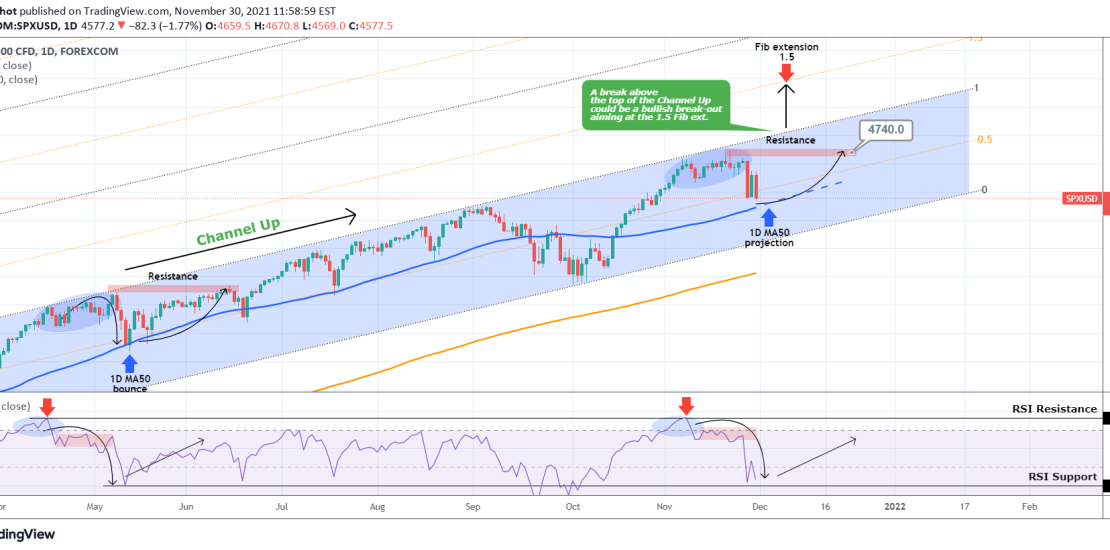
It is time to update our perspective on the S&P500, which we last analyzed a week ago when we called the exact market top on November 22: As you see the index got rejected that day and corrected instantly, which based on our analysis is a much needed technical correction in accordance with the
-
S&P500 The 1D RSI is overbought on a big red signal
- November 5, 2021
- Posted by: Tradingshot Articles
- Category: Stock Indices
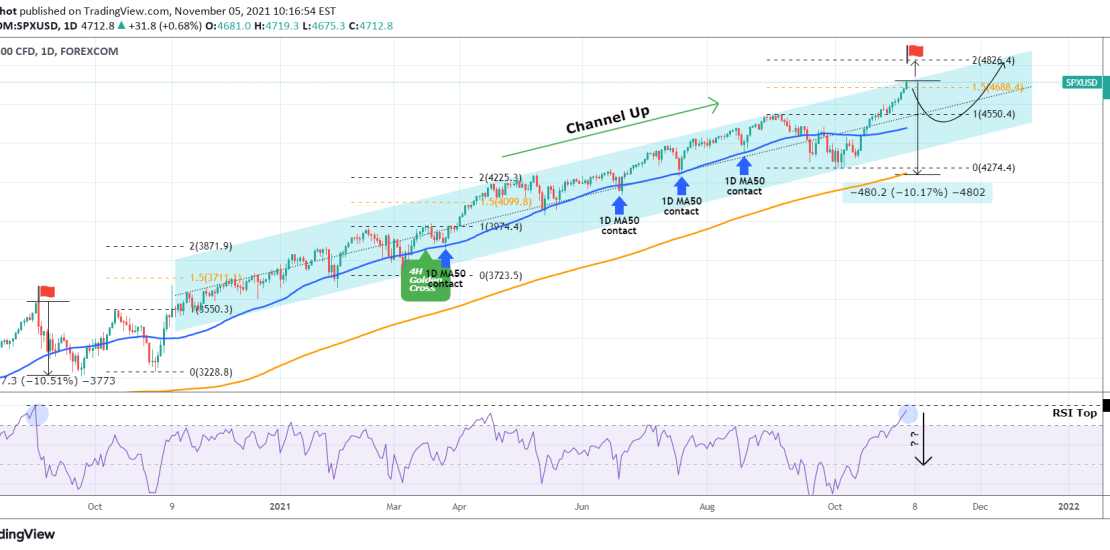
S&P has been trading within a Channel Up ever since the November 2020 U.S. elections. During that time, the RSI on the 1D time-frame has never gone above 76.30. Right now however, it is overbought and approaching the 80.000 Resistance where it was last seen on September 03 2020. As you see on the
-
S&P500 One last 1D MA50 touch left before $4800?
- October 29, 2021
- Posted by: Tradingshot Articles
- Category: Stock Indices
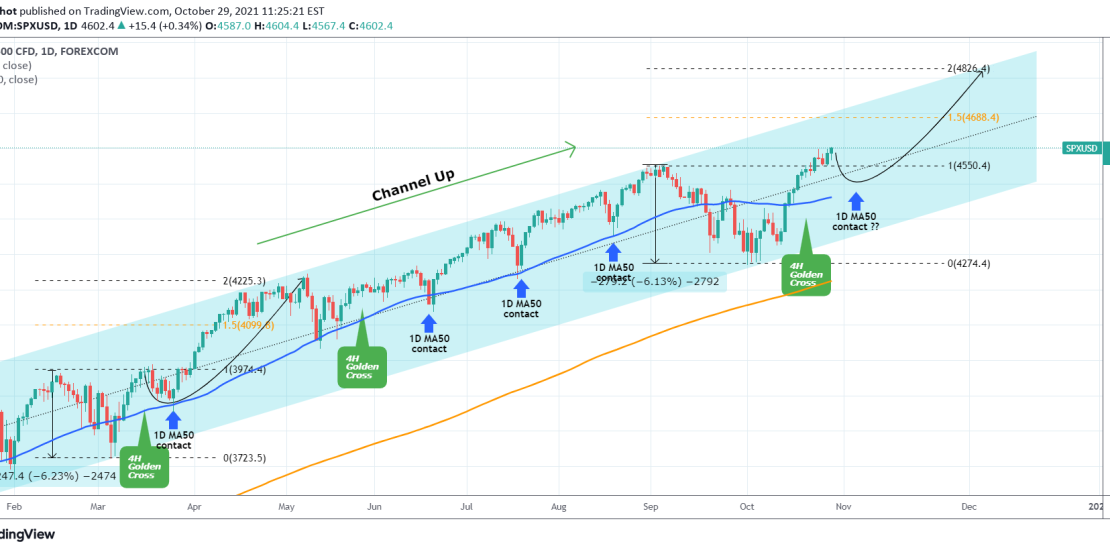
S&P has made new All Time Highs (ATH) since my analysis at the start of the month, where the diverging 1D RSI gave a strong buy signal at the bottom of the multi-month Channel Up: As you see the signal worked out well and the index has now the 1.5 Fibonacci extension as its
-
NASDAQ 4H Golden Cross aims at 16300 long-term
- October 25, 2021
- Posted by: Tradingshot Articles
- Category: Stock Indices
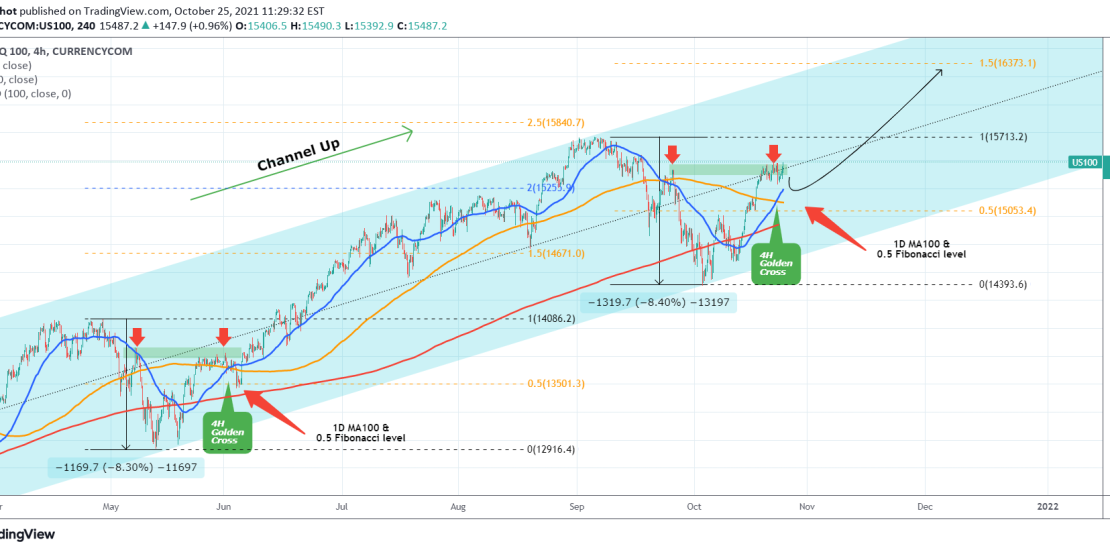
My most recent Nasdaq post was a buy signal on the 1D MA50: Currently we have a buy continuation signal for the long-term towards the 1.5 Fibonacci extension (16300) with a potential short-term pull-back to add more longs on the 0.5 Fib retracement or the 1D MA100 (red trend-line). This is based on the May
-
DAX Bullish continuation towards 16000.
- October 25, 2021
- Posted by: Tradingshot Articles
- Category: Stock Indices
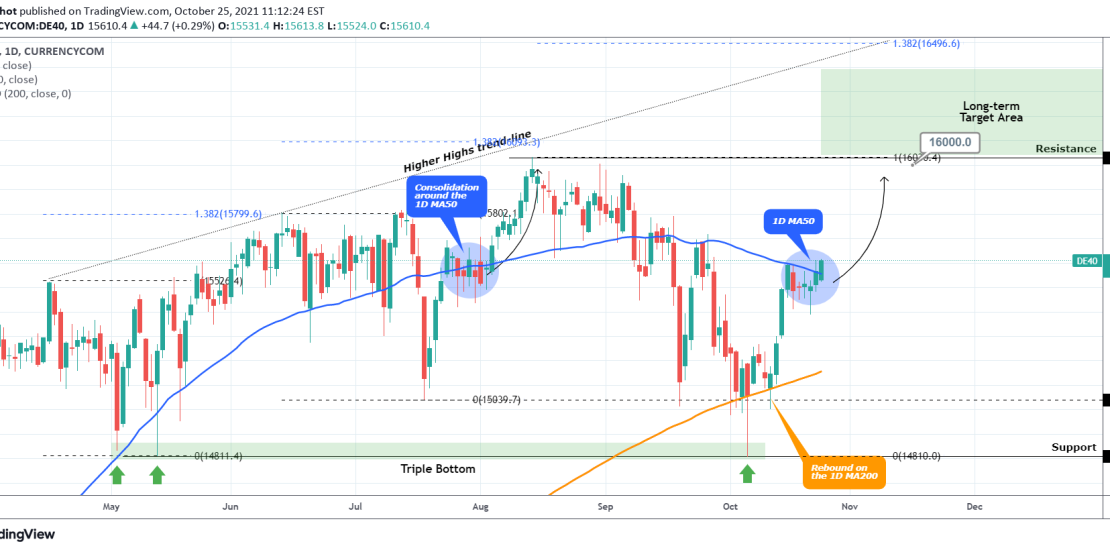
My last DAX analysis was on a bus signal after the price broke above the 4H MA50: The short-term target of the 4H MA200 eventually got reached and now I shift my focus for the medium-term back to the 1D time-frame. As you see the price has been trading around the 1D MA50 (blue
-
NASDAQ Testing the 1D MA50
- October 15, 2021
- Posted by: Tradingshot Articles
- Category: Stock Indices
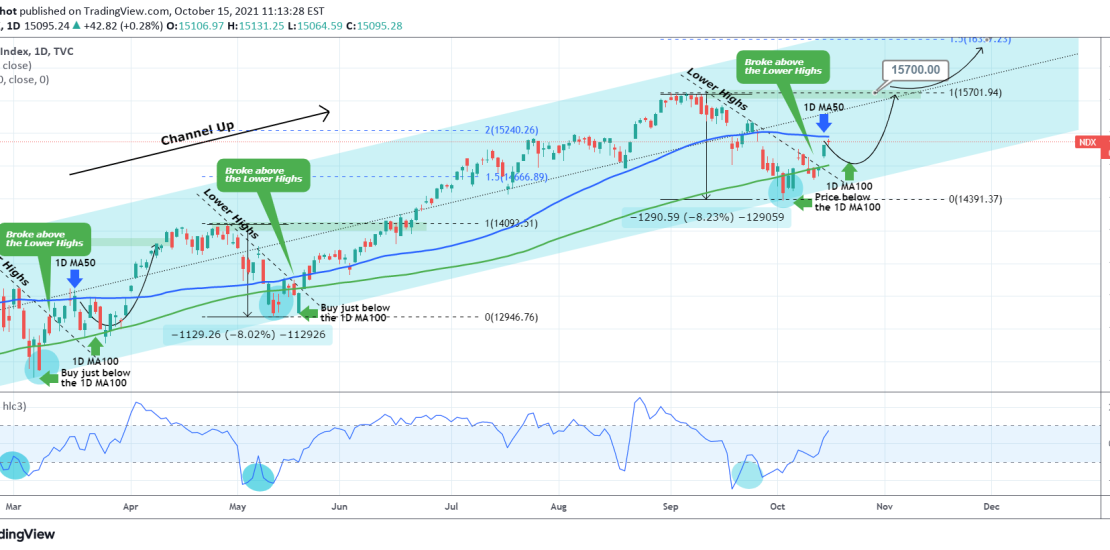
It’s been some times since my last update on Nasdaq. As you see on my previous idea below, the break below the 1D MA100 (green trend-line) turned out to be accurate as the index made a Higher Low at the bottom of the long-term Channel Up and rebounded: The first bearish barrier broke when
-
S&P500 Emerging Golden Cross on 4H.
- October 15, 2021
- Posted by: Tradingshot Articles
- Category: Stock Indices
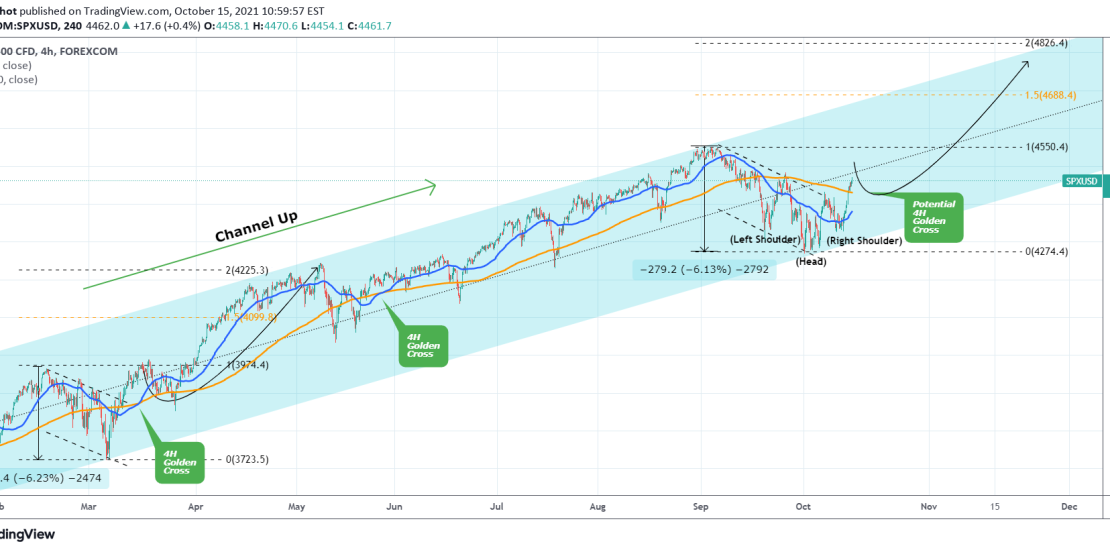
My most recent analysis on S&P500 was 15 days ago, when I talked about why the Bearish Ichimoku was in fact a bullish signal: As it turned out, the signal was accurate and SPX made a bottom on the Higher Lows trend-line of the Channel Up and rebounded. In fact it even broke above
-
DAX Broke above the 4H MA50. Buy Signal.
- October 13, 2021
- Posted by: Tradingshot Articles
- Category: Stock Indices

Pattern: Channel Up on 4H. Signal: Buy as the price broke above the 4H MA50. Target: 15500 (just below the 4H MA200). Tradingview link: https://www.tradingview.com/chart/DE40/lQZC7m65-DAX-Broke-above-the-4H-MA50-Buy-Signal
-
DOW JONES Buy Signal
- October 13, 2021
- Posted by: Tradingshot Articles
- Category: Stock Indices
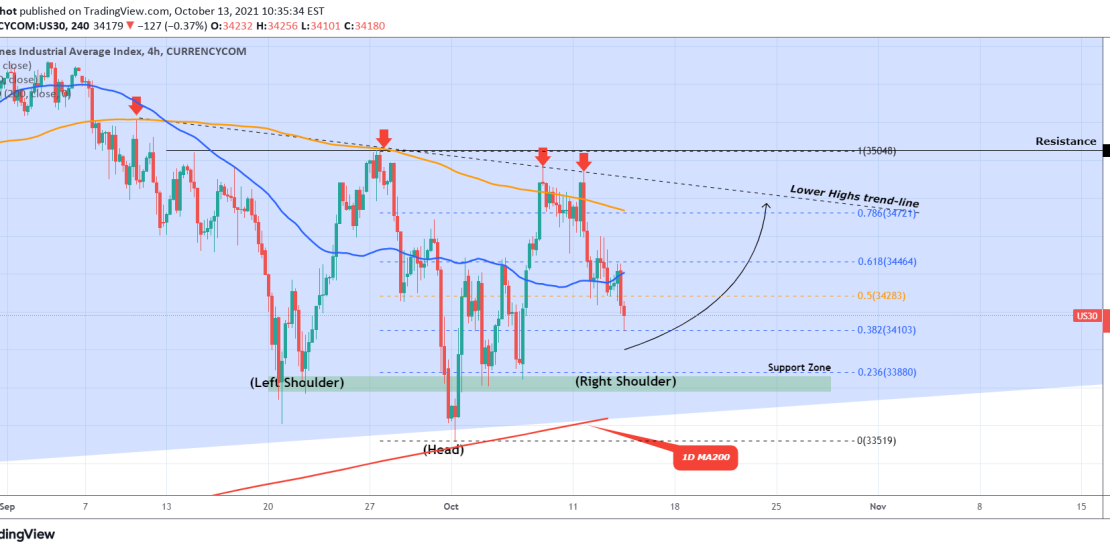
Pattern: Inverse Head and Shoulders on 4H. Signal: Buy as the price is close to completing the Right Shoulder and is on the 0.382 Fibonacci retracement level. Target: 34700 which is the 0.786 Fibonacci retracement level just below the Lower Highs trend-line. Tradingview link: https://www.tradingview.com/chart/US30/WrZ0DBte-DOW-JONES-Buy-Signal
-
NASDAQ on 1D Buy Signal
- October 4, 2021
- Posted by: Tradingshot Articles
- Category: Stock Indices
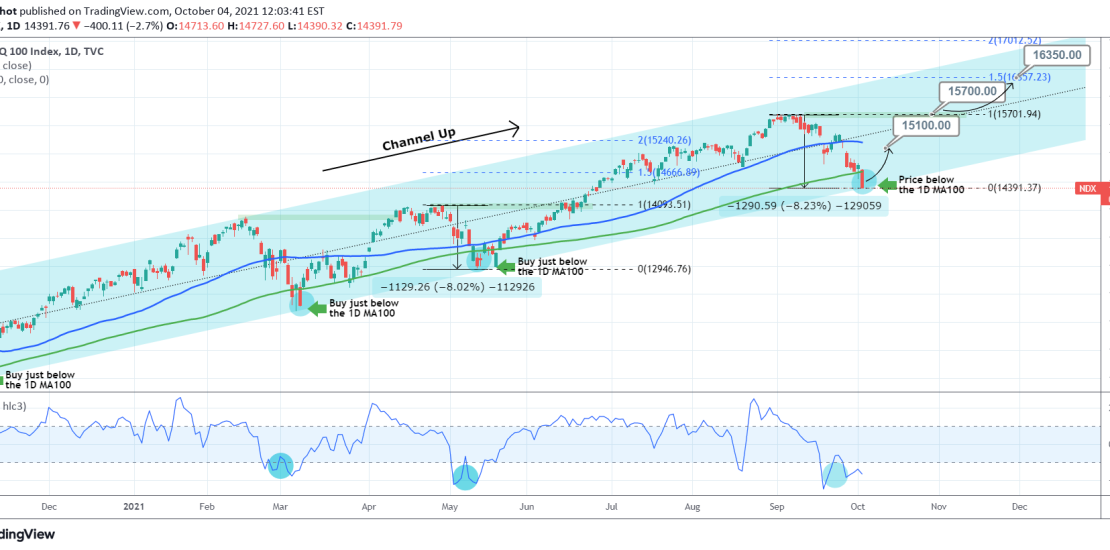
Pattern: Channel Up on 1D. Signal: Buy as the price is at the bottom of the Channel Up, below the 1D MA100 (green trend-line, which has accurately given a long-term buy signal 3 times since November 2020) and the 1D CCI is on Higher Lows at its bottom. Target: Short-term 15100 (the 1D MA50),