

- October 15, 2021
- Posted by: Tradingshot Articles
- Category: Stock Indices
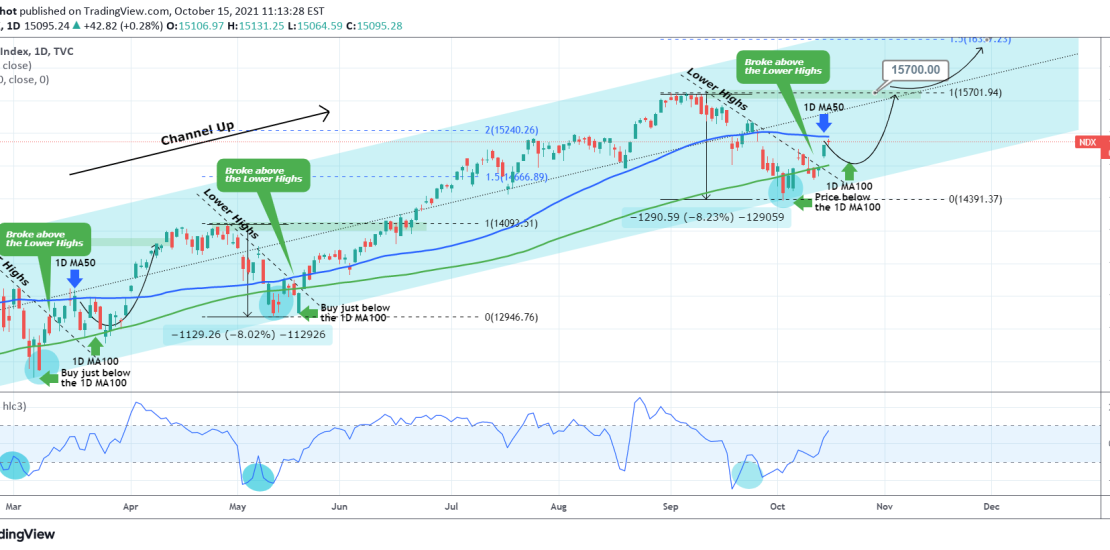
It’s been some times since my last update on Nasdaq. As you see on my previous idea below, the break below the 1D MA100 (green trend-line) turned out to be accurate as the index made a Higher Low at the bottom of the long-term Channel Up and rebounded:

The first bearish barrier broke when the Lower Highs (inner) trend-line broke. As you see on all past fractals within the Channel Up (since November 2020), that signaled the start of a rise to a new All Time High (and Higher High for the Channel Up). However as the price is now testing the 1D MA50, if rejected, it may take another week or so before resuming the uptrend, assuming the 1D MA100 holds as Support, in a similar way to the March sequence.
The long-term targets on Nasdaq remain 15700 and 16350 in extension.
Tradingview link:
https://www.tradingview.com/chart/NDX/p4t8AikV-NASDAQ-Testing-the-1D-MA50