

- October 15, 2021
- Posted by: Tradingshot Articles
- Category: Stock Indices
My most recent analysis on S&P500 was 15 days ago, when I talked about why the Bearish Ichimoku was in fact a bullish signal:

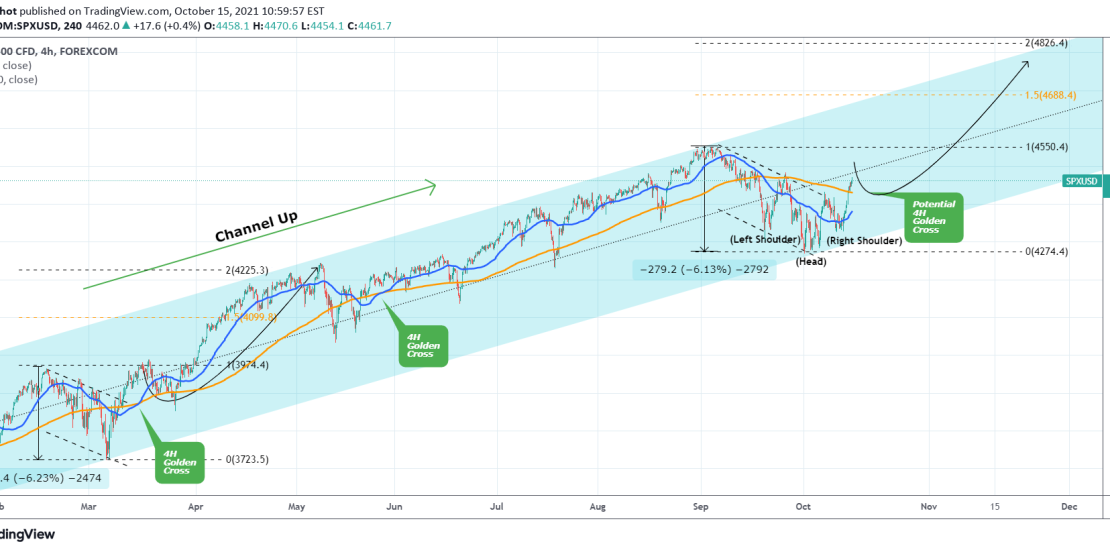
As it turned out, the signal was accurate and SPX made a bottom on the Higher Lows trend-line of the Channel Up and rebounded. In fact it even broke above the 1D MA50, the strongest short-term bearish barrier (also the 4H MA200) and is closing in on the 4480 September 27 High.
The pattern seems like a peculiar Inverse Head and Shoulders, which is a bullish formation, but perhaps even more important than that is the fact that we have a potential 4H Golden Cross (when the 4H MA50 crosses above the 4H MA200) forming. Ever since the November 2020 U.S. elections, every Golden Cross on the 4H time-frame has been heavily bullish.
I mentioned on my last update that this price action resembles the February-March fractal and currently I see no reason to change that. I expect a test of the 1.5 and 2.0 Fibonacci extensions towards the end of November for a new Higher High on this long-term Channel Up.
Tradingview link:
https://www.tradingview.com/chart/SPXUSD/gRmLsCt0-S-P500-Emerging-Golden-Cross-on-4H