

- October 29, 2021
- Posted by: Tradingshot Articles
- Category: Stock Indices
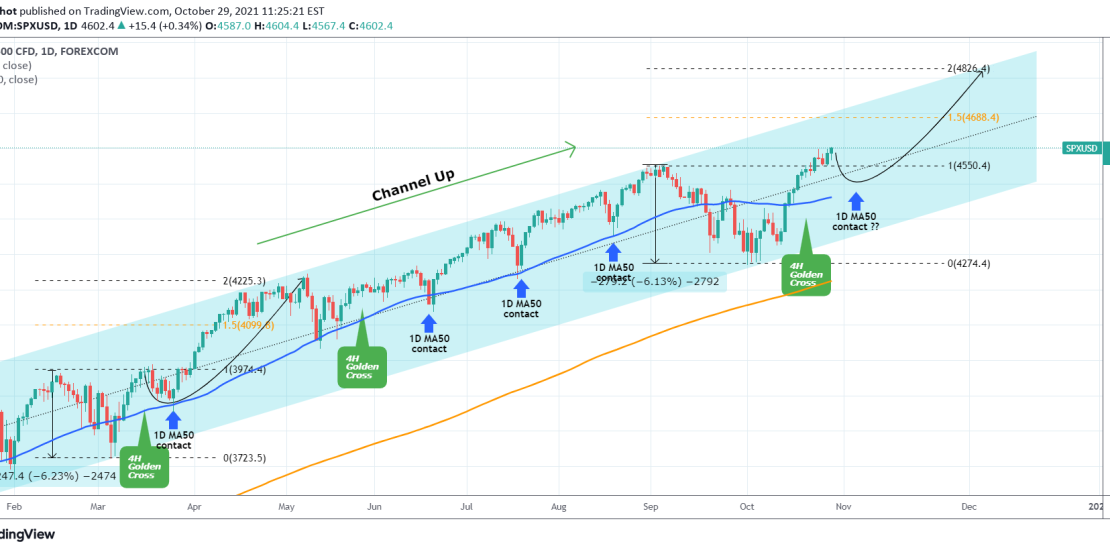
S&P has made new All Time Highs (ATH) since my analysis at the start of the month, where the diverging 1D RSI gave a strong buy signal at the bottom of the multi-month Channel Up:

As you see the signal worked out well and the index has now the 1.5 Fibonacci extension as its next target (followed by the 2.0 Fib ext ultimately just above 4800). As the Fed Rate Decision is approaching next week, there is a possibility that the market sells the news on the short-term, make contact with the 1D MA50 (blue trend-line) and then rally for the rest of the month.
After all from a technical perspective, the 1D MA50 has supported from March until the recent September break-out.
Tradingview link:
https://www.tradingview.com/chart/SPXUSD/UGqdDFkb-S-P500-One-last-1D-MA50-touch-left-before-4800