

-
S&P500 The 4H MA50 is the key
- March 26, 2021
- Posted by: Tradingshot Articles
- Category: Stock Indices
No Comments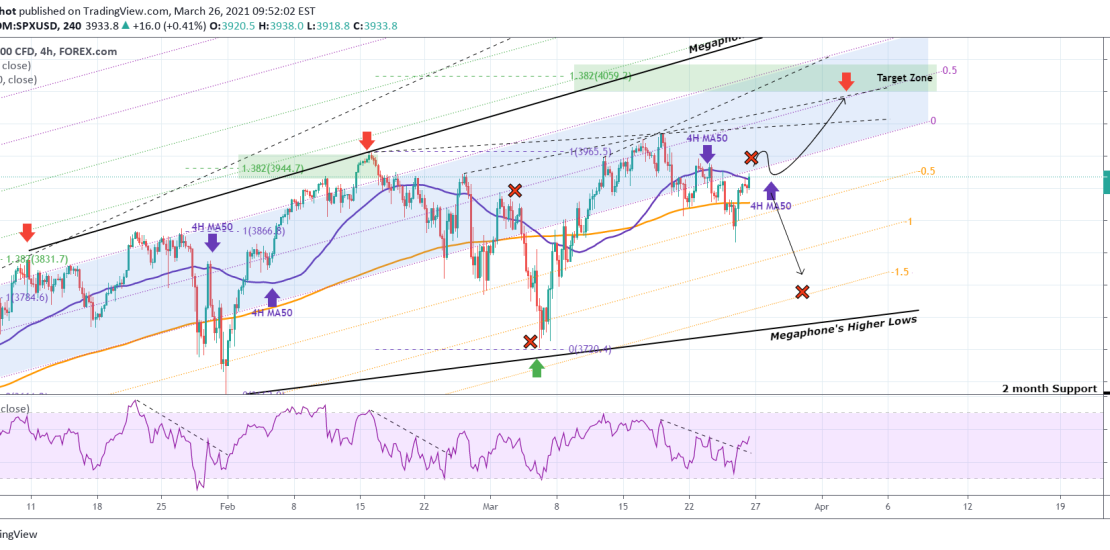
Pattern: Bullish Megaphone. Signal: (A) Buy if after the 4H MA50 break-out (blue trend-line), the level holds (as on Feb 02 – 04). If it doesn’t, (B) sell towards the lower (-) Fibonacci extensions (as on March 01 – March 04). Target: (A) The 0.5 Fib (rough estimate 4040). (B) The -1.5 Fib (rough
-
S&P500 Strong MA Support Zone below
- March 18, 2021
- Posted by: Tradingshot Articles
- Category: Stock Indices
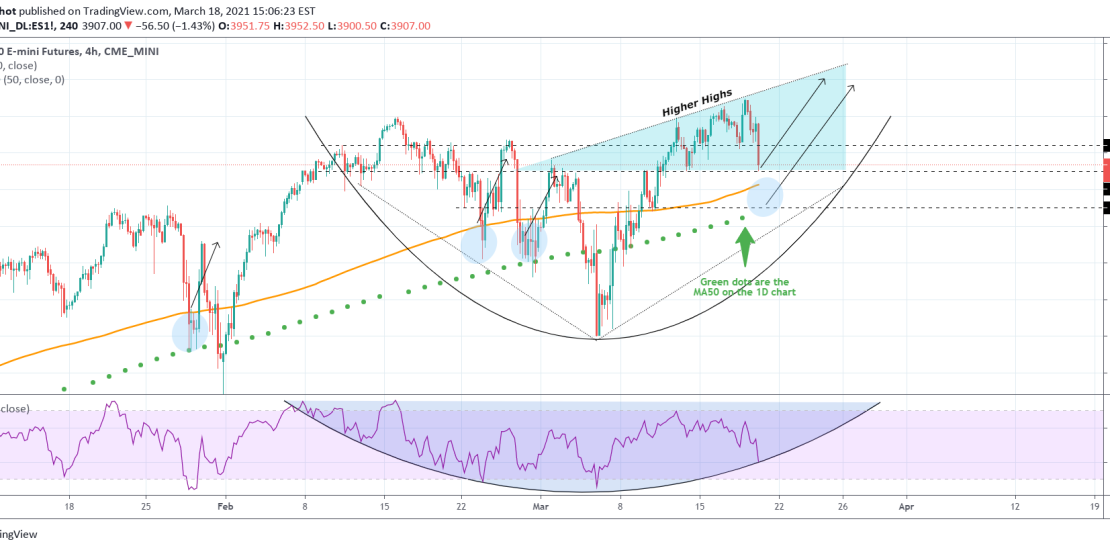
The 4H MA200 (orange trend-line) with the 1D MA50 (green dots) have recently provided rebounds on S&P500 more often than not, acting as a Support Zone. As you see on the chart those happen to be also on key horizontal Support levels (3900 – 3860). With the 4H RSI making contact with its parabolic
-
S&P500 Bullish Break-out
- March 10, 2021
- Posted by: Tradingshot Articles
- Category: Stock Indices
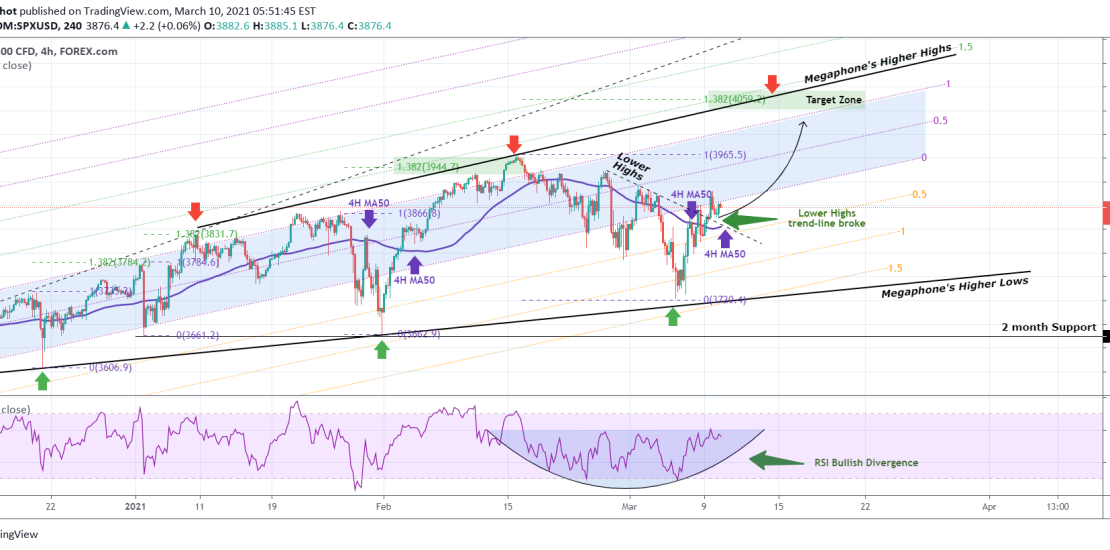
Pattern: Bullish Megaphone on 4H. Signal: Buy as the price broke above the inner Lower Highs trend-line and is turning the 4H MA50 (blue trend-line) into Support. The RSI is on a Bullish Divergence. Target: 4,040 long-term (the 1.382 Fibonacci extension ). Previous S&P signal: ** Please support this idea with your likes and
-
S&P500 Buy Signal
- March 5, 2021
- Posted by: Tradingshot Articles
- Category: Stock Indices
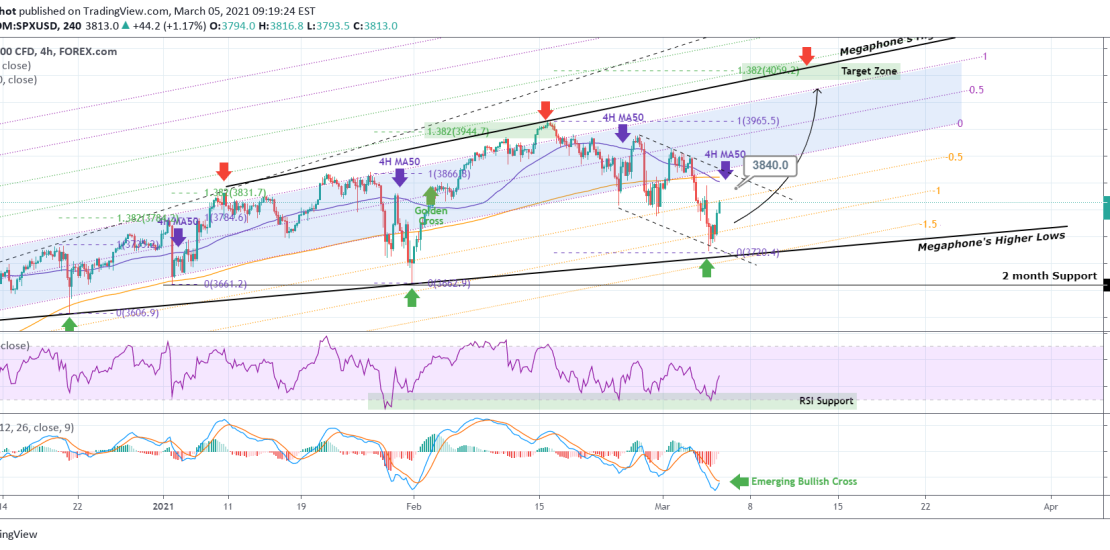
Pattern: Bullish Megaphone on 4H. Signal: Buy as the price just rebounded right above the Megaphone’s Higher Lows trend-line. The RSI did the same on its own Support, while the MACD is close to forming a Bullish Cross. Target: 3840 short-term (right above the 4H MA50 as on the Feb 24/ March 01 rebounds)
-
S&P500 Buy conditions
- February 3, 2021
- Posted by: Tradingshot Articles
- Category: Stock Indices
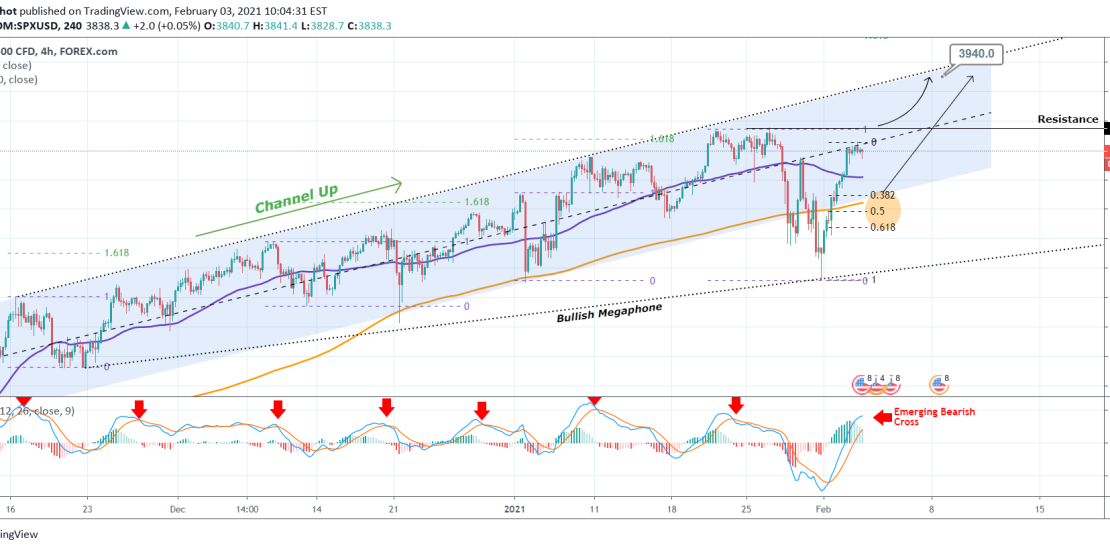
Pattern: Channel Up into a Bullish Megaphone. Signal: Buy either after a pull-back within the 0.382-0.618 Fibonacci is completed (because the 4H MACD is close to forming a Bearish Cross) or if the 3870 Resistance breaks first. Target: 3940 (top of the pattern). ** Please support this idea with your likes and comments, it
-
S&P500 aims at 3800
- December 29, 2020
- Posted by: Tradingshot Articles
- Category: Stock Indices
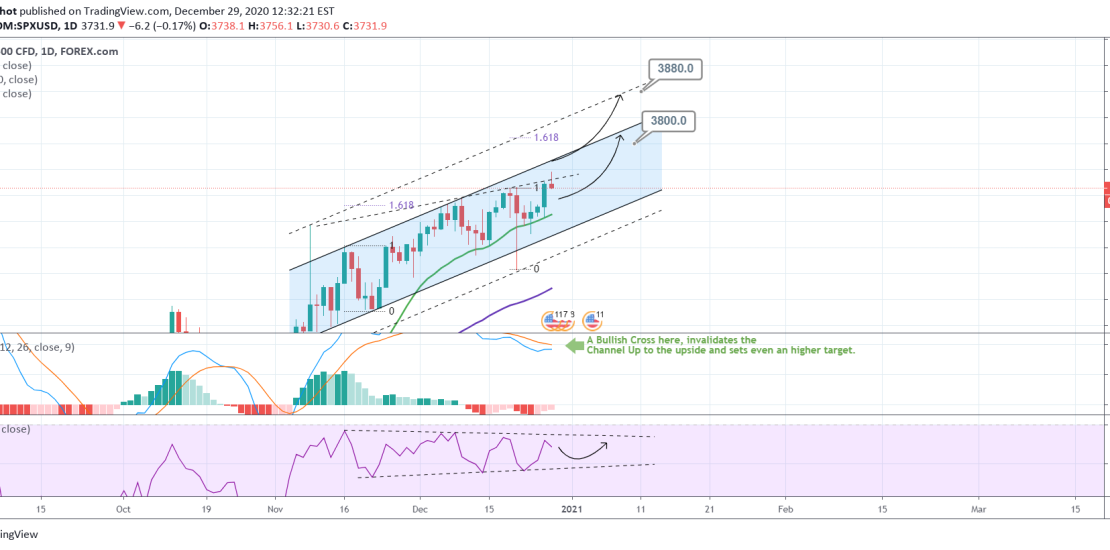
Pattern: Channel Up on 1D. Signal: Buy (a) if the MACD makes a Bullish Cross (every prior 1D Bullish Cross has delivered an extreme rise), or (b) if the RSI approaches its Higher Lows trend-line. Target: (a) 3880, (b) 3800 ** Please support this idea with your likes and comments, it is the best
-
S&P500 preparing an end of the year rally to 3780
- December 17, 2020
- Posted by: Tradingshot Articles
- Category: Stock Indices
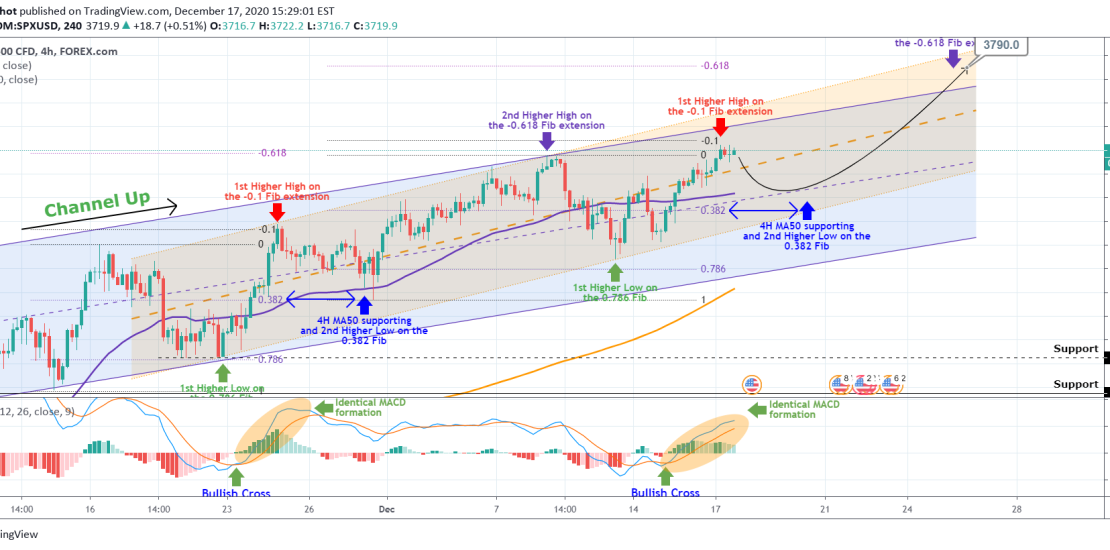
SPX continues to trade within the Channel Up that I previously spotted and right now the keys are a certain Fibonacci sequence as well as the MACD formation on the 4H time-frame. As you see the MACD is printing a similar formation with November 23 – 26. That was when S&P500 made its aggressive
-
DAX Channel Up or Inverted Head and Shoulders?
- December 10, 2020
- Posted by: Tradingshot Articles
- Category: Stock Indices
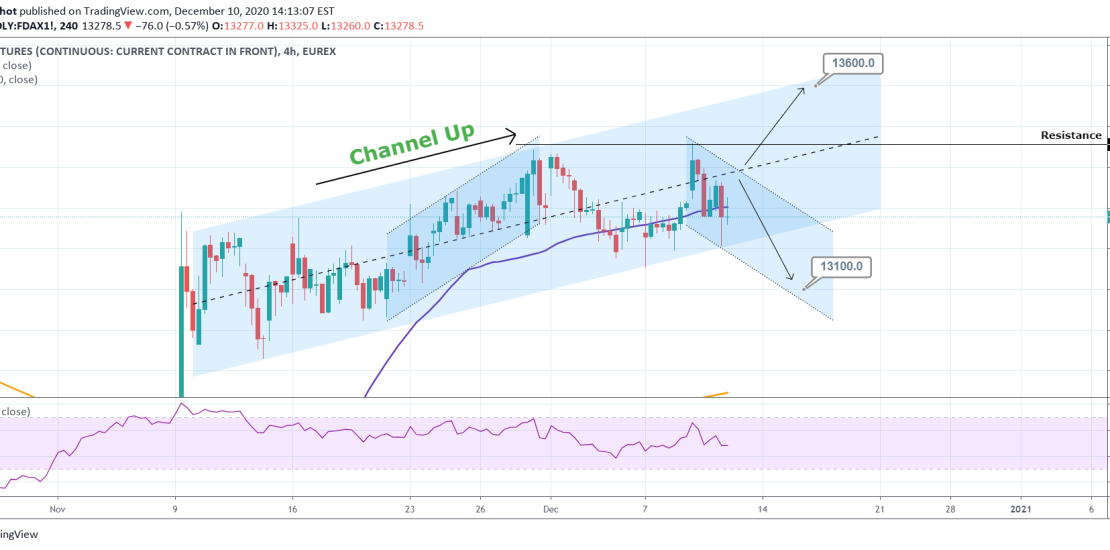
Pattern: Channel Up on 4H. Signal: Buy but only if the price breaks above the middle of the Channel again. Otherwise the pattern may turn into an Inverted Head and Shoulders. Target: 13600 (Higher High trend-line of the Channel Up). Please like, subscribe and share your ideas and charts with the community! ——————————————————————————————————– !!
-
DOW JONE Buy Signal
- December 10, 2020
- Posted by: Tradingshot Articles
- Category: Stock Indices
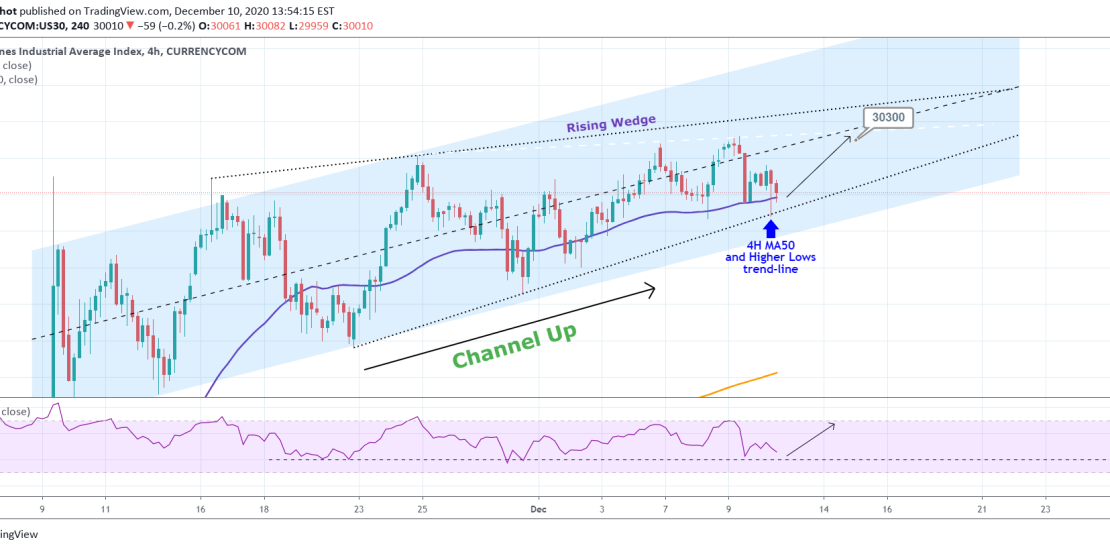
Pattern: Rising Wedge inside a Channel Up. Signal: Buy as the price hit the 4H MA50 on the Higher Lows trend-line of the Rising Wedge. Target: 30300 (The Higher Highs trend-line of the Rising Wedge). Please like, subscribe and share your ideas and charts with the community! ——————————————————————————————————– !! Donations via TradingView coins also
-
S&P500 Trading Plan
- November 22, 2020
- Posted by: Tradingshot Articles
- Category: Stock Indices
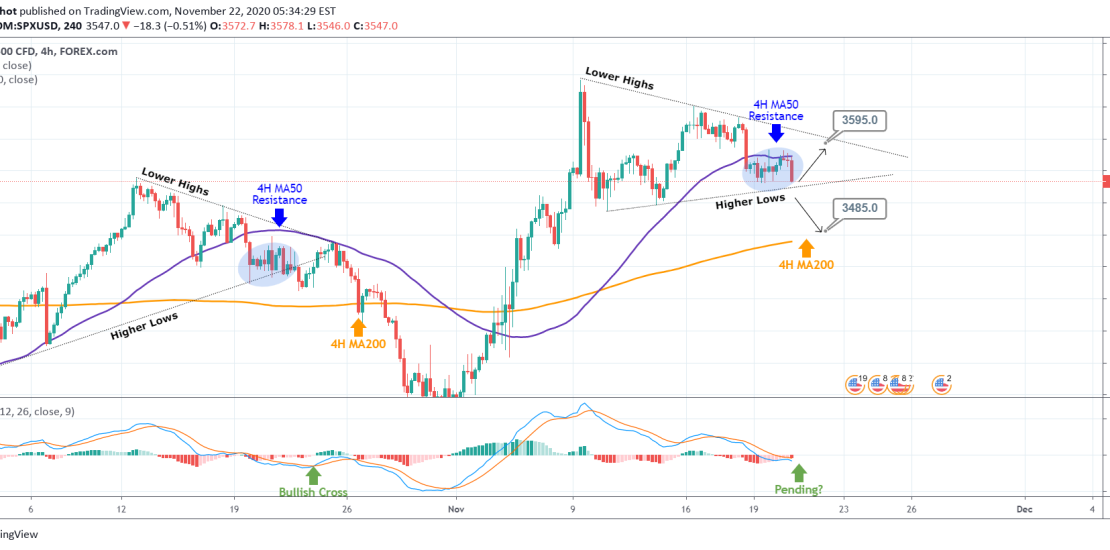
Pattern: Triangle on 4H. Signal: (A) Buy as long as the Higher Lows trend-line holds, (B) Sell if it breaks. Target: (A) 3595 (just below the Lower Highs), (B) 3485 (just above the 4H MA200). ** Please support this idea with your likes and comments, it is the best way to keep it relevant