

- March 18, 2021
- Posted by: Tradingshot Articles
- Category: Stock Indices
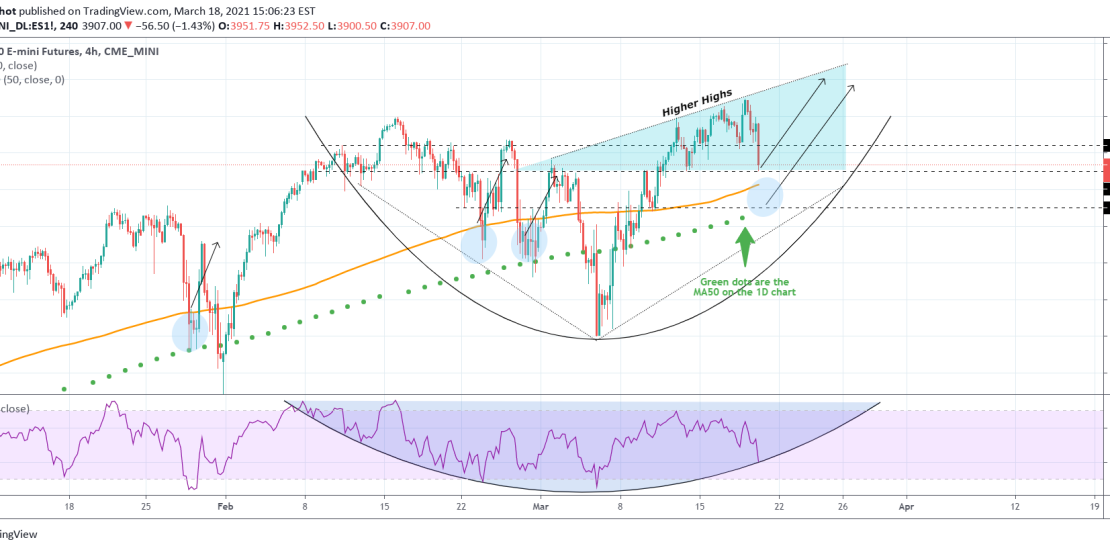
The 4H MA200 (orange trend-line) with the 1D MA50 (green dots) have recently provided rebounds on S&P500 more often than not, acting as a Support Zone.
As you see on the chart those happen to be also on key horizontal Support levels (3900 – 3860). With the 4H RSI making contact with its parabolic line, it is possible that the index is nearing a Support that will provide at least a short-term rebound. Use the Higher Highs line for a potential Target.
** Please support this idea with your likes and comments, it is the best way to keep it relevant and support me. **
——————————————————————————————————–
!! Donations via TradingView coins also help me a great deal at posting more free trading content and signals here !!
🎉 👍 Shout-out to TradingShot’s 💰 top TradingView Coin donor 💰 this week ==> xBTala
Tradingview link:
https://www.tradingview.com/chart/ES1!/h0yeZXVT-S-P500-Strong-MA-Support-Zone-below