

- December 17, 2020
- Posted by: Tradingshot Articles
- Category: Stock Indices
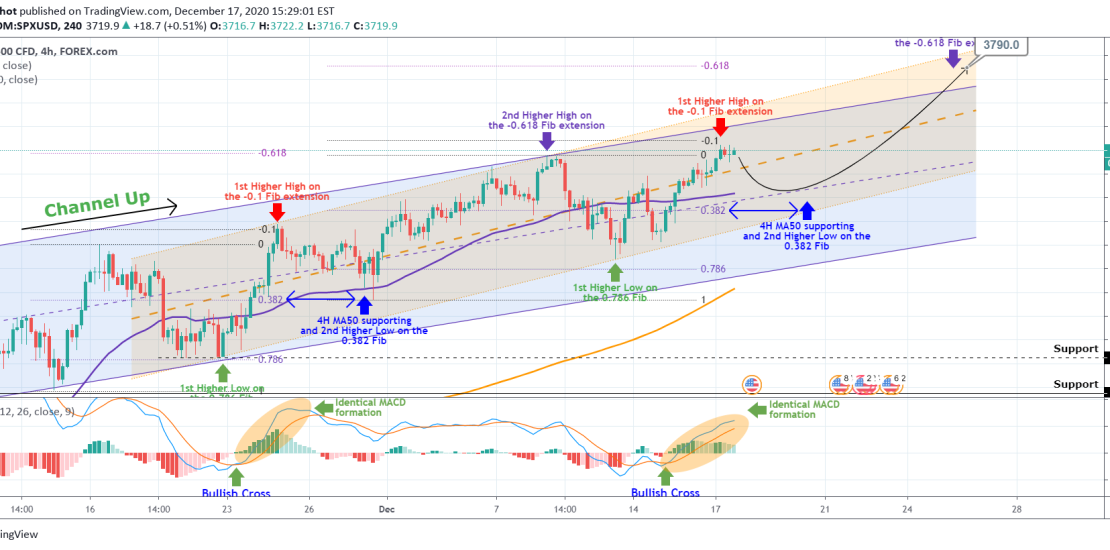
As you see the MACD is printing a similar formation with November 23 – 26. That was when S&P500 made its aggressive Bullish Leg from 3545 to 3655. It made its top on the -0.1 Fibonacci extension then pulled back to the 0.382 Fib retracement and took some time to price a Higher High on the -0.618 Fib extension.
If the same pattern is repeated, then the price could pull back seeking support within the 4H MA50 and 0.382 Fib and then rise to the -0.618 extension which is around 3790. That would set up S&P on a nice end-of-the-year rally.
** Please support this idea with your likes and comments, it is the best way to keep it relevant and support me. **
——————————————————————————————————–
!! Donations via TradingView coins also help me a great deal at posting more free trading content and signals here !!
🎉 👍 Shout-out to TradingShot’s 💰 top TradingView Coin donor 💰 this week ==> TradingView
——————————————————————————————————–