

- June 23, 2021
- Posted by: Tradingshot Articles
- Category: Stock Indices
No Comments
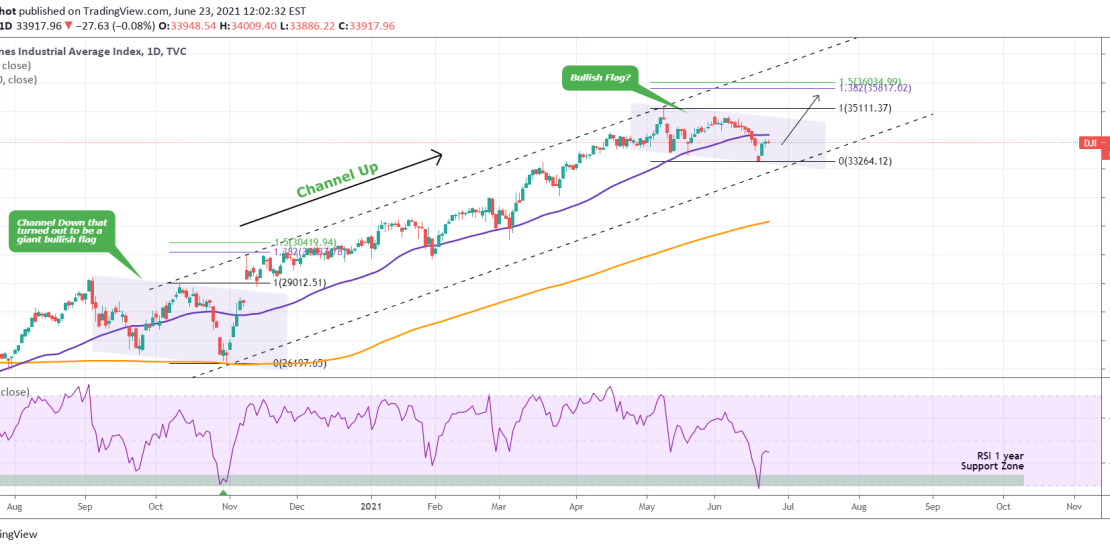
DJIA has been trading within a Channel Up since the U.S. elections last November. However since the May 10 Top, it has been trading under Lower Highs and Lower Lows which are the characteristics of a Channel Down.
Last time we had such pattern was the sequence before the U.S. elections, which turned out to be a giant Bullish Flag. The 1D RSI has bounced off the 1 year Support Zone, same as late October prior to the elections. Can this be a similar Bullish Flag? If yes then Dow Jones will aim at the 1.382 – 1.5 Fibonacci Zone.
Tradingview link:
https://www.tradingview.com/chart/DJI/iHpkzYbT-DOW-JONES-Is-this-a-giant-Bullish-Flag