

- June 28, 2021
- Posted by: Tradingshot Articles
- Category: Stock Indices
No Comments
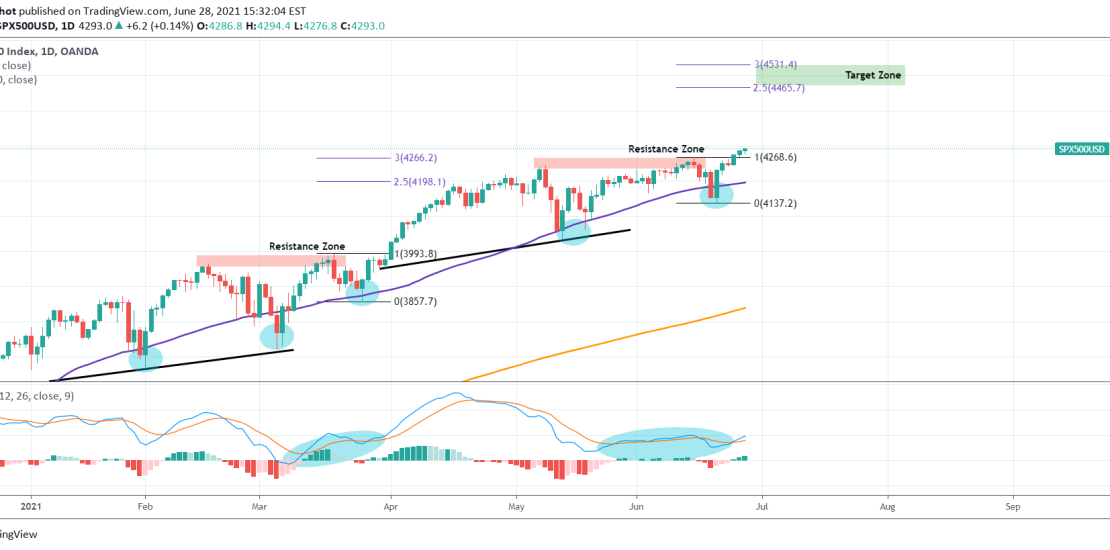
This is something I’ve also pointed out a month ago but after last week’s rebound on the 1D MA50 (blue trend-line) it got even clearer. S&P seems to be replicating the March/ April fractal where after a break-out above the Resistance Zone (on a 1D MA50 rebound), the price rallied to a level within the 2.5 – 3.0 Fibonacci extension zone. Do you agree that 4450 is a realistic target based on this?
Tradingview link:
https://www.tradingview.com/chart/SPX500USD/aMjLyRQD-S-P500-March-April-fractal-points-to-above-4450