

- June 3, 2021
- Posted by: Tradingshot Articles
- Category: Stock Indices
No Comments
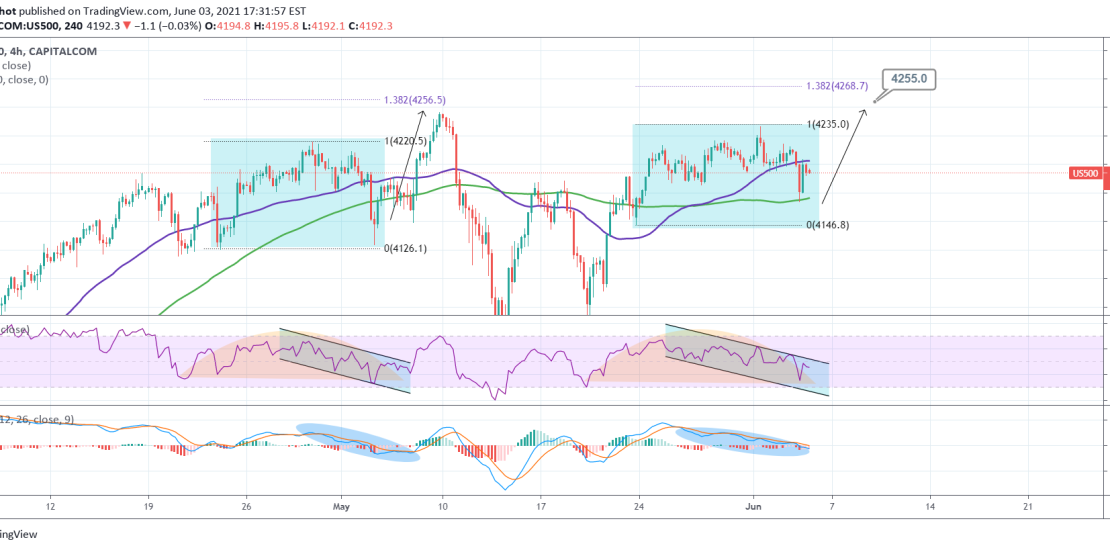
Both in terms of RSI/ MACD and the way the price trades on the 4H MA50 (blue trend-line) and the 4H MA100 (green trend-line), S&P500 appears to be replicating the late April – early May fractal. After a bottom on the Support, the price rebounded just below the 1.382 Fibonacci extension. That is currently just below 4270. I believe that following tomorrow’s Nonfarm Payrolls, as similar price spike will occur.
Most recent S&P500 analysis:

Tradingview link: