-
S&P500 The Cup pattern that nobody notices!
- May 17, 2023
- Posted by: Tradingshot Articles
- Category: Stock Indices
No Comments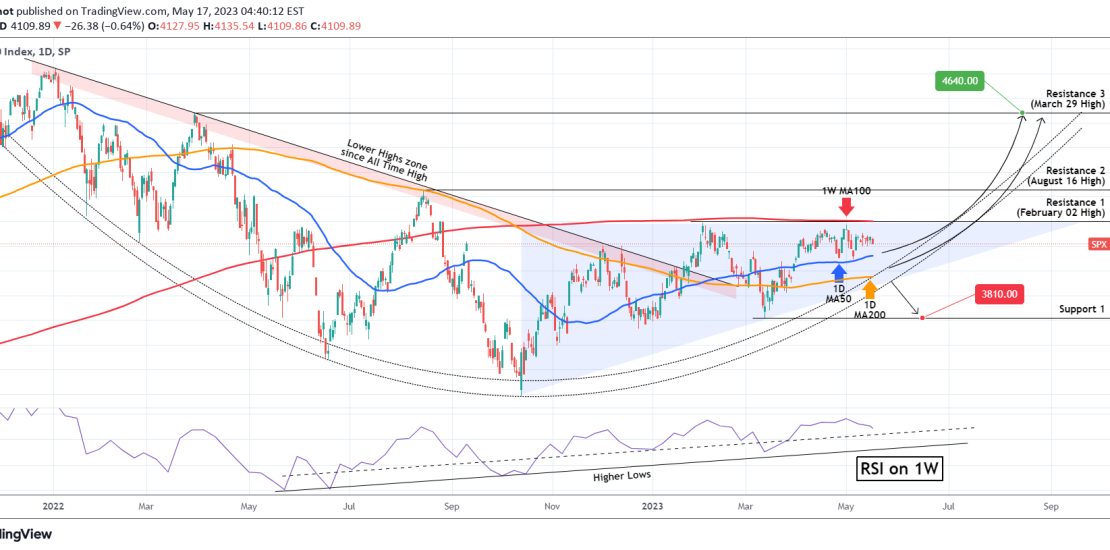
We have been so focused on the short-term Channel Up on the S&P500 (SPX) since March (see idea below) that we didn’t publish any analysis on the longer term dynamics: This analysis offers critical insight on where we are with regards to the long-term/ Cyclical trend. One parameter that stands out is that the S&P500
-
NASDAQ broke above the 1W MA100 after a year!
- May 16, 2023
- Posted by: Tradingshot Articles
- Category: Stock Indices
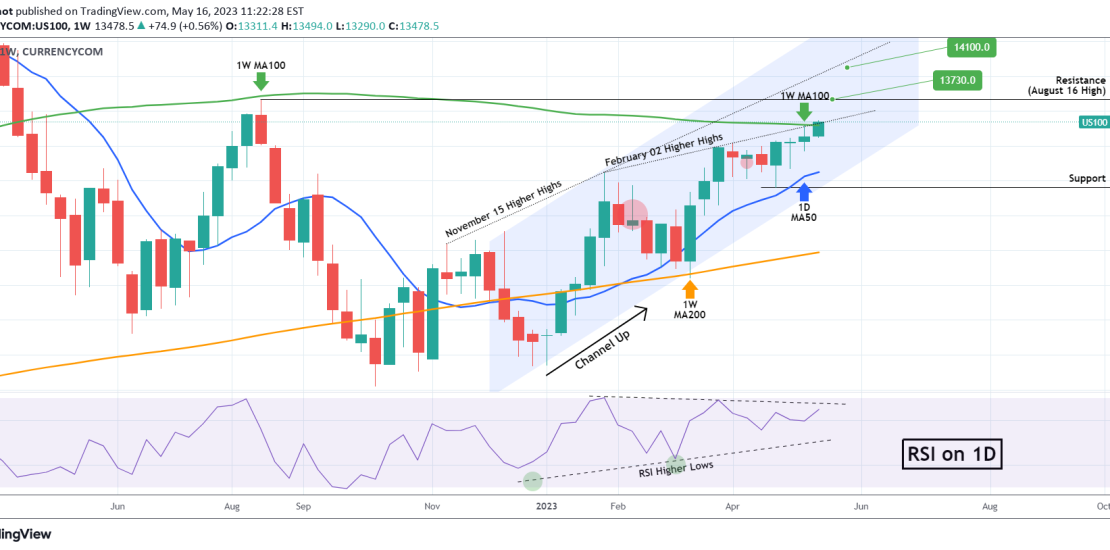
Nasdaq (NDX) is extending the bullish trend inside the short-term Channel Up as mentioned on are recent idea two weeks ago (see below): Today the index reached a very important benchmark as it broke above the 1W MA100 (green trend-line) for the first time in more than 1 year (since the 1W candle of April
-
S&P500 Megaphone pattern on 4H.
- May 3, 2023
- Posted by: Tradingshot Articles
- Category: Stock Indices
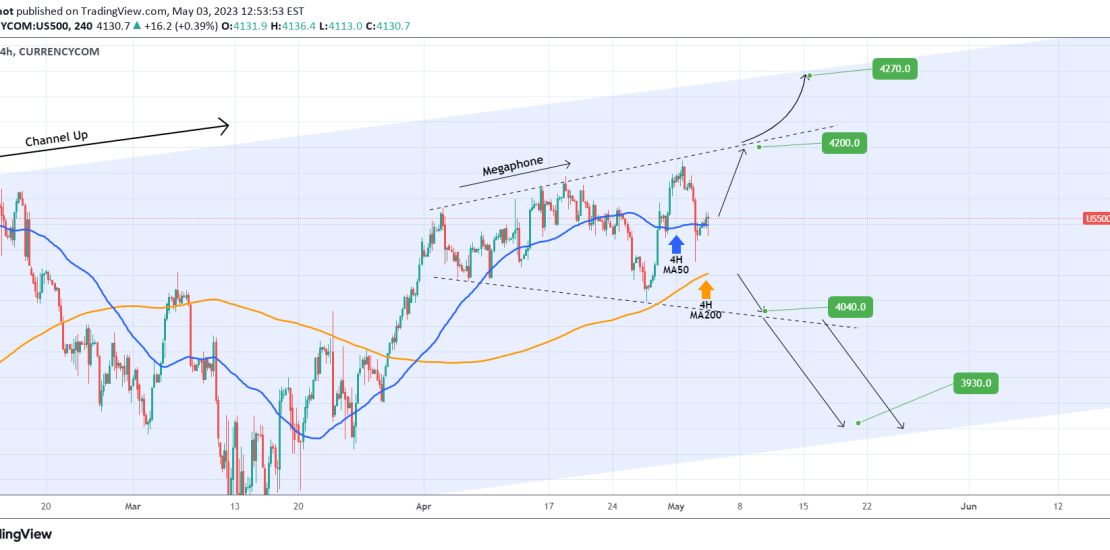
The S&P500 (SPX) has had an excellent run following our buy call more than one month ago: Right now we see a Megaphone pattern in formation on the 4H time-frame and with the price above the 4H MA50 (blue trend-line) and with the 4H MA200 (orange trend-line) holding since March 29, we are targeting the
-
NASDAQ Bullish within a Double Channel Up
- May 2, 2023
- Posted by: Tradingshot Articles
- Category: Stock Indices
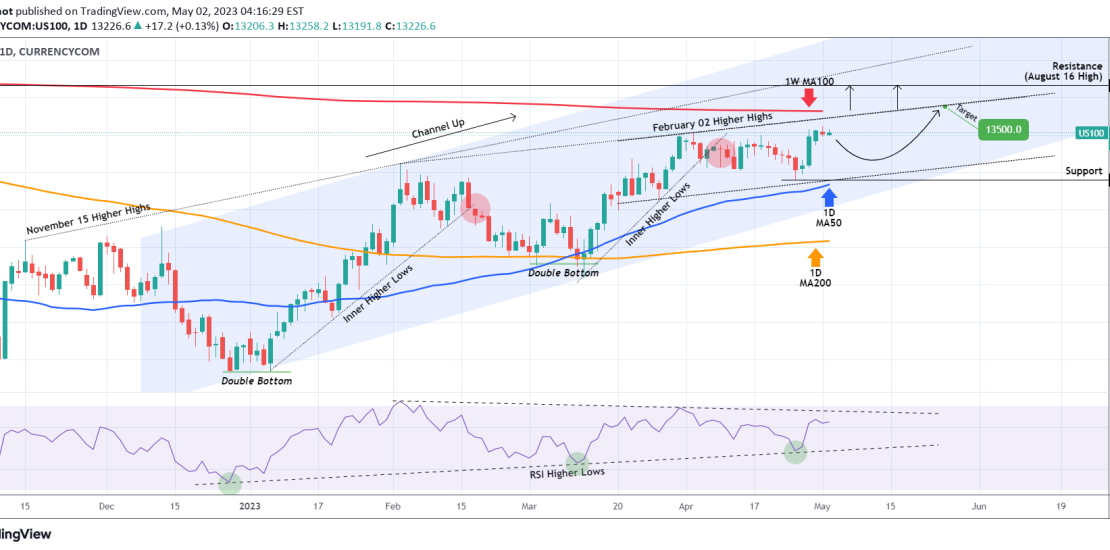
Nasdaq (NDX) has gone a long way since we called for a rebound on the 1D MA200 on March 17: Right now the uptrend has slowed down as the Channel Up that started in December has transitioned into a much less aggressive Channel Up, supported by the 1D MA50 (blue trend-line) that is targeting 13500
-
S&P500 Cyclical buy signal starting next month
- April 21, 2023
- Posted by: Tradingshot Articles
- Category: Stock Indices
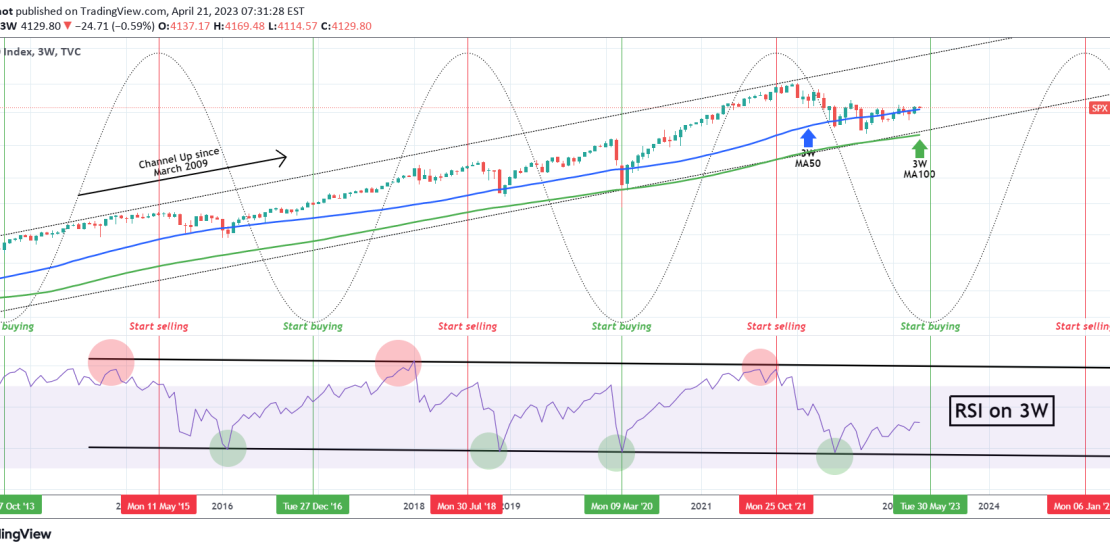
This analysis is basically an extension of the study we published last week, explaining how the index is starting an aggressive expansion: Based purely on the 3W time-frame, now we have incorporated the Sine Waves to clearly display the cyclical buy/ sell pattern inside the long-term Channel Up that started at the bottom of the
-
S&P500 starting an expansion the likes of which we’ve never seen
- April 14, 2023
- Posted by: Tradingshot Articles
- Category: Stock Indices
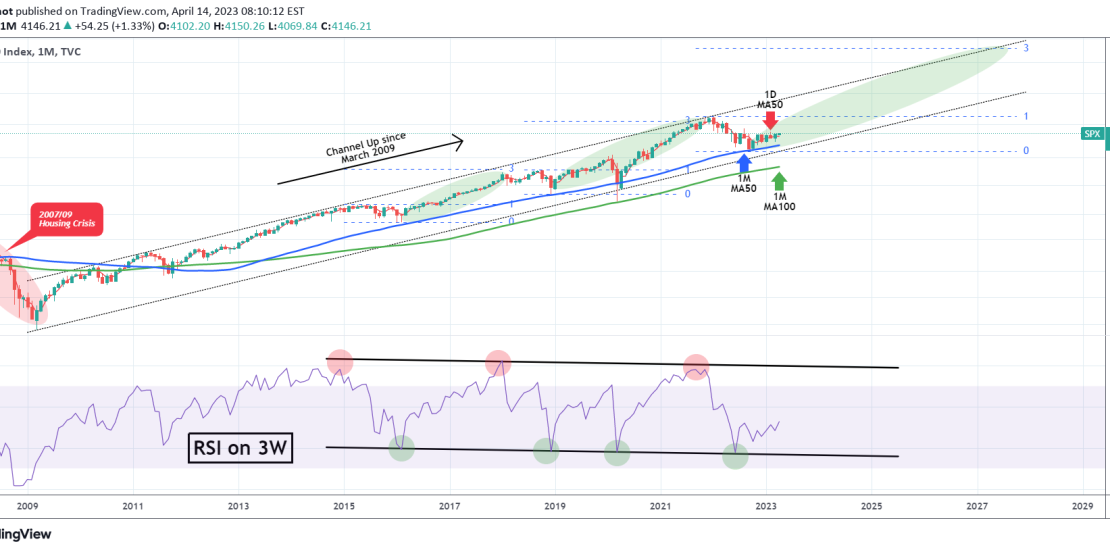
The S&P500 index (SPX) is trading on a multi-year Channel Up pattern that started on the March 2009 bottom of the Housing (subprime mortgage) Crisis. With all the talk lately on whether or not the index is out of its Bear Phase, this chart can offer great insight on the long-term trend. As you see,
-
S&P500 Buy without fear. Bull not over until 2030.
- March 30, 2023
- Posted by: Tradingshot Articles
- Category: Stock Indices
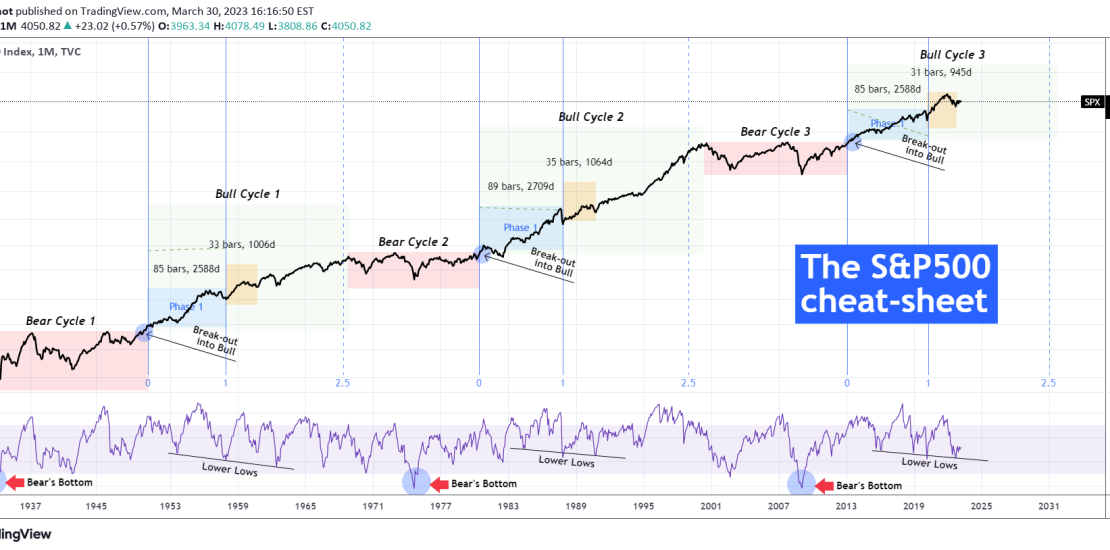
This is not the first time we look into the S&P500 (SPX) from a multi-decade perspective. Every time we look into the Cycles since the Great Depression we bring an additional element to the table. This time we break down parts of those Cycles even more and look into the RSI as well. This analysis
-
S&P500 is pricing the new Low of the bullish leg.
- March 23, 2023
- Posted by: Tradingshot Articles
- Category: Stock Indices
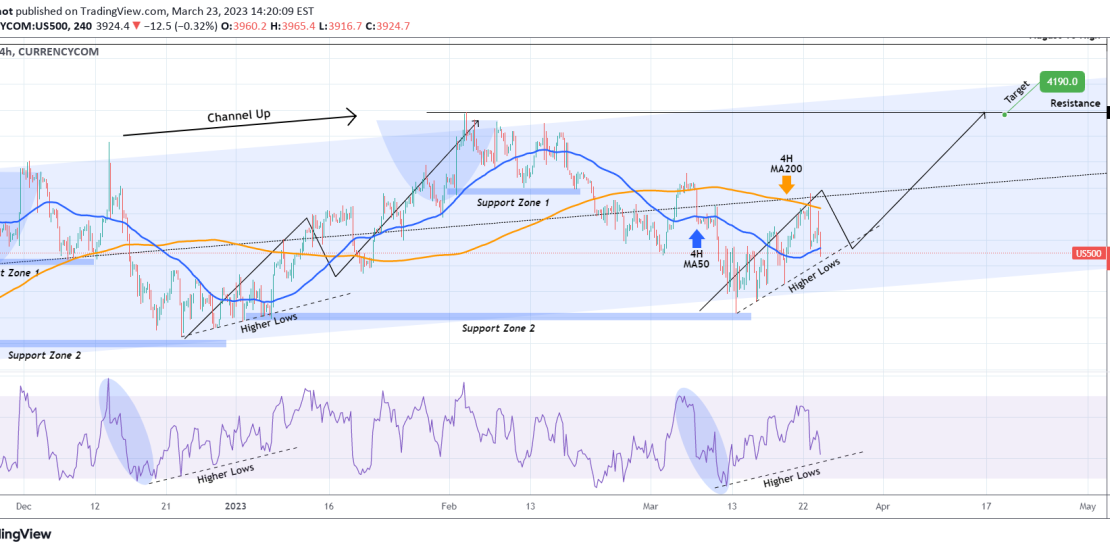
The S&P500 (SPX) hit today the 4H MA50 (blue trend-line) again and the Higher Lows since the March 13 bottom. That was a bottom on the 5-month Channel Up and the best buy opportunity on a 1 month time-frame. With the 4H RSI sequence similar to the Higher Lows of the previous bullish leg in
-
DAX is starting a long-term rally to 16100
- March 21, 2023
- Posted by: Tradingshot Articles
- Category: Stock Indices
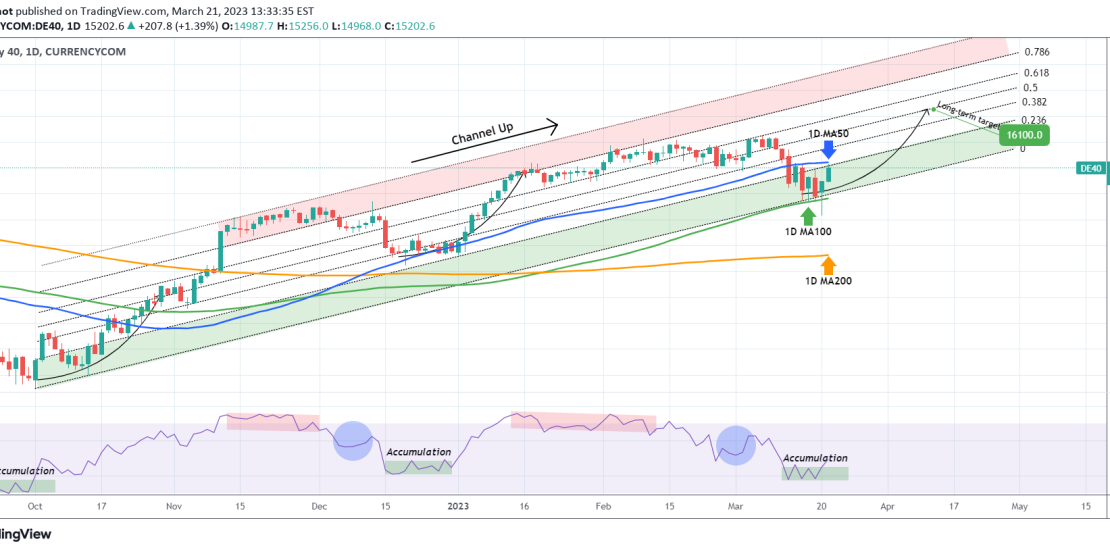
DAX is now testing the 1D MA50 (blue trend-line) having rebounded at the bottom of its long-term (since the October 03 Low) Channel Up and the 1D MA100 (green trend-line). With the 1D RSI coming out of its Accumulation Zone, as in the previous two Lows (late September and late December 2022), we expect this
-
DOW JONES has started the new bullish wave.
- March 21, 2023
- Posted by: Tradingshot Articles
- Category: Stock Indices
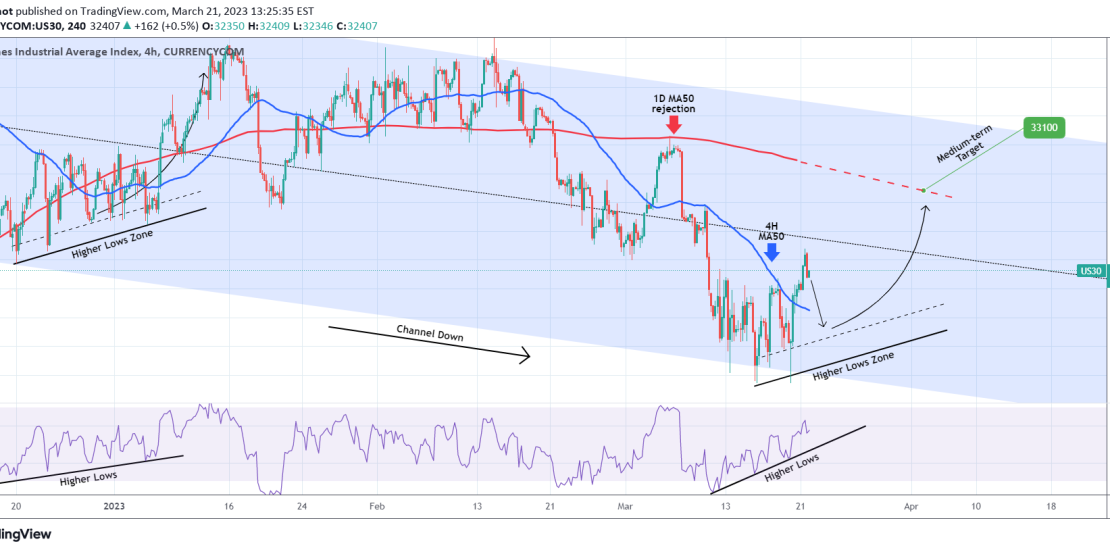
This is basically to last week’s buy signal at the bottom: As you see Dow Jones (DJI) made a new Lower Low (bottom) on the 4-month Channel Down and broke above the 4H MA50 (blue trend-line) again. The move is supported by a Higher Lows Zone (as is the RSI), similar to the previous Channel

