

- April 14, 2023
- Posted by: Tradingshot Articles
- Category: Stock Indices
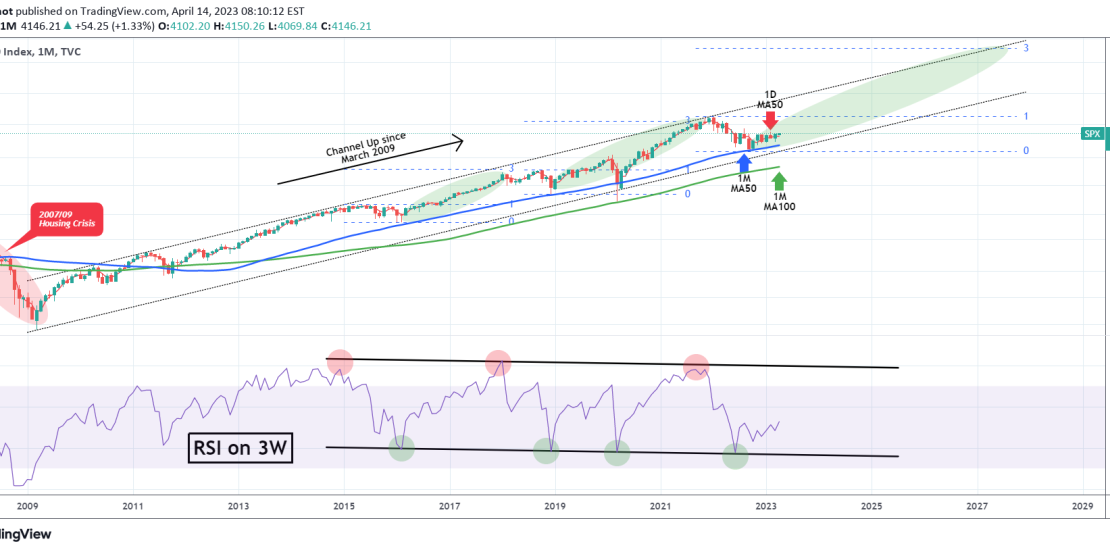
The S&P500 index (SPX) is trading on a multi-year Channel Up pattern that started on the March 2009 bottom of the Housing (subprime mortgage) Crisis. With all the talk lately on whether or not the index is out of its Bear Phase, this chart can offer great insight on the long-term trend.
As you see, it shows that the Bear Market’s bottom was priced in September 2022 exactly on the 1M MA50 (blue trend-line), which has served as a Support both on December 2018 (peak of U.S. – China trade war) and January 2016 (China’s slowdown, VW scandal, Oil crash). As we are all aware March 2020 was an exception (black swan event) that happens once in a hundred years. Still the 1M MA100 (green trend-line) supported.
The key here is the 3W RSI. It is trading within a Channel Down and every time the price hit its bottom, a multi-month rally started. The last two times that rally peaked on the 3.0 Fibonacci extension. Calculating the new 3.0 Fib from the 4840 top to the 3500 bottom, it gives roughly a 9000 projection. So since this is only the start on this Expansion Phase within the multi-year Channel Up pattern, it is not at all unlikely to expect steady growth from the current levels and a rough 9000 peak by 2027.
Tradingview link: