

- March 31, 2021
- Posted by: Tradingshot Articles
- Category: Commodities
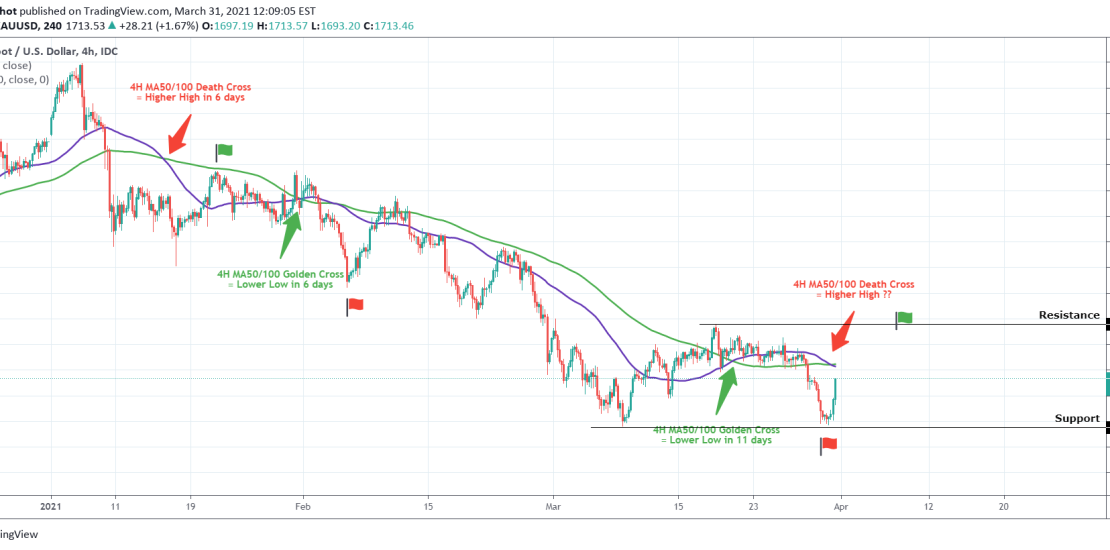
Today Gold is on a strong rebound as it held the 1675.50 Support made from the March 08 Low. But the reason for this short post is to bring forward the counter signal that the MA50/ 100 Cross give on the 4H time-frame.
As you see on the chart since January 14 the MA50 (blue trend-line) and the MA100 (green trend-line) on the 4H time-frame have crossed paths 4 times:
* On Jan 14 we had a Death Cross, which is theoretically bearish but 6 days later the price ended higher instead making a Higher High.
* On Jan 24 we had a Golden Cross, which is theoretically bullish but 6 days later the price ended lower instead making a Lower Low.
* On March 19 we had a Golden Cross, but again 11 days later the price ended lower instead making a Lower Low.
* Today (March 31) we had a Death Cross, but again the price is on a strong rise. Will that make a Higher High and if so will it be below the 1755.50 Resistance?
Feel free to share your work and let me know in the comments section!
Please like, subscribe and share your ideas and charts with the community!
——————————————————————————————————–
!! Donations via TradingView coins also help me a great deal at posting more free trading content and signals here !!
🎉 👍 Shout-out to TradingShot’s 💰 top TradingView Coin donor 💰 this week ==> xBTala
Tradingview link:
https://www.tradingview.com/chart/XAUUSD/PTfLOh66-GOLD-The-peculiar-4H-MA50-100-Cross-divergence