- April 8, 2021
- Posted by: Tradingshot Articles
- Category: Commodities

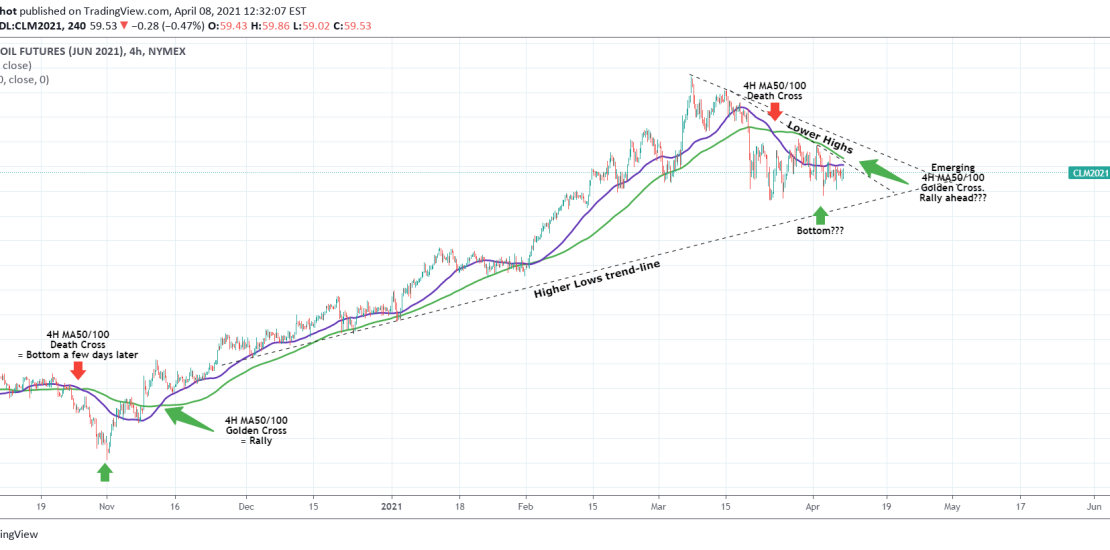
Simple fractal comparison on WTI as the price is consolidating since the March 23 low and is approaching the Higher Lows trend-line that started on December 01.
As you see the current price action is quite similar to the late October – early November one. After the 4H MA50 crossed below the 4H MA100, a bottom was formed a few days later. Once the two crossed again on a Golden Cross this time, the very aggressive rally of December – March was initiated. We are on a similar situation right now. Has the March 23 MA50/100 Death Cross priced the Bottom? And if yes will an emerging MA50/100 Golden Cross kick-start a rally?
** Please support this idea with your likes and comments, it is the best way to keep it relevant and support me. **
——————————————————————————————————–
!! Donations via TradingView coins also help me a great deal at posting more free trading content and signals here !!
🎉 👍 Shout-out to TradingShot’s 💰 top TradingView Coin donor 💰 this week ==> hujianghua
Tradingview link:

