- March 26, 2021
- Posted by: Tradingshot Articles
- Category: Commodities

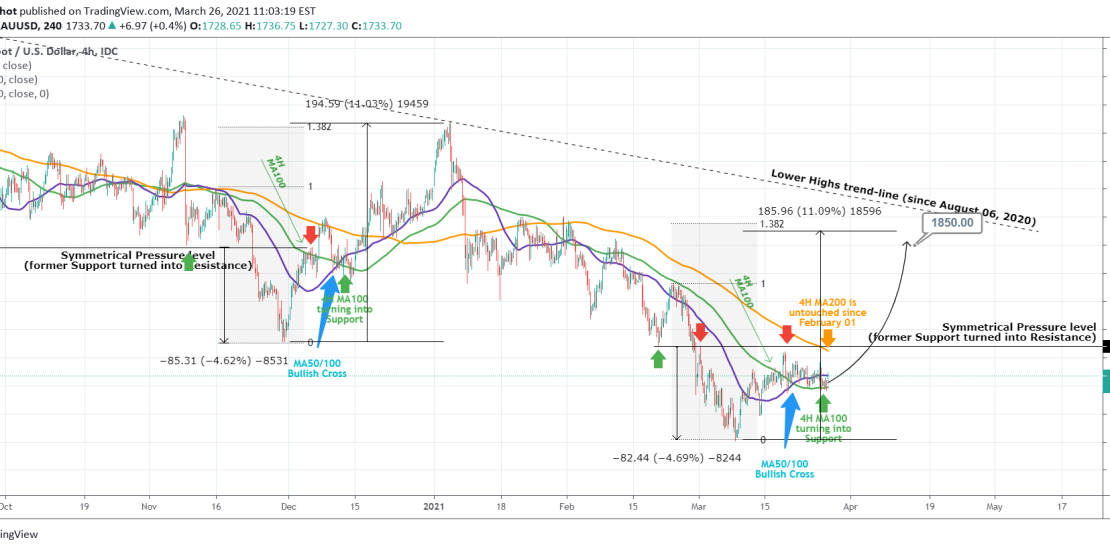
This is a fractal comparison on XAUUSD between the current sequence and that of December 2020.
At the moment Gold is trading on top of the 4H MA100 (green trend-line) using it as a Support and around the 4H MA50 (blue trend-line) using it as a Pivot. It still hasn’t broken above neither the Symmetrical Pressure level (former Support, currently Resistance) of 1760 or the 4H MA200 (orange trend-line). Technically once those break, the trend switches from neutral to bullish.
Almost the same sequence was seen back in December. After the market Bottom of Nov 30, Gold rose and after it broke the 4H MA100, a Bullish Cross followed (4H MA50 crossing above the 4H MA100). The difference is that the 4H MA200 got hit then (and the Symmetrical Pressure level broke) before the Bullish Cross, whilst today it hasn’t. Then the 4H MA100 held as Support and the price rose aggressively to complete a +11% rise in total.
Another common characteristic of the two fractals that stands out is the fact that both made a Bottom at around -4.60% from the Symmetrical Pressure level.
The January 06, 2021 High was roughly over the 1.382 Fibonacci extension. If approximately the same price action is followed, then Gold can top anywhere within 1860-1870, so it makes sense to have a bullish target slightly below (1850). That would still be below the Lower Highs trend-line that started on the August 06 2020 market Top, which until it breaks, we can’t confirm a long-term bullish reversal.
** Please support this idea with your likes and comments, it is the best way to keep it relevant and support me. **
——————————————————————————————————–
!! Donations via TradingView coins also help me a great deal at posting more free trading content and signals here !!
🎉 👍 Shout-out to TradingShot’s 💰 top TradingView Coin donor 💰 this week ==> jsunde73
Tradingview link:
https://www.tradingview.com/chart/XAUUSD/Qfed3wMQ-GOLD-aims-at-1850-Similarities-with-December-2020

