2023 January
-
XAGUSD Hanging on a tight thread about to turn bearish.
- January 31, 2023
- Posted by: Tradingshot Articles
- Category: Commodities
No Comments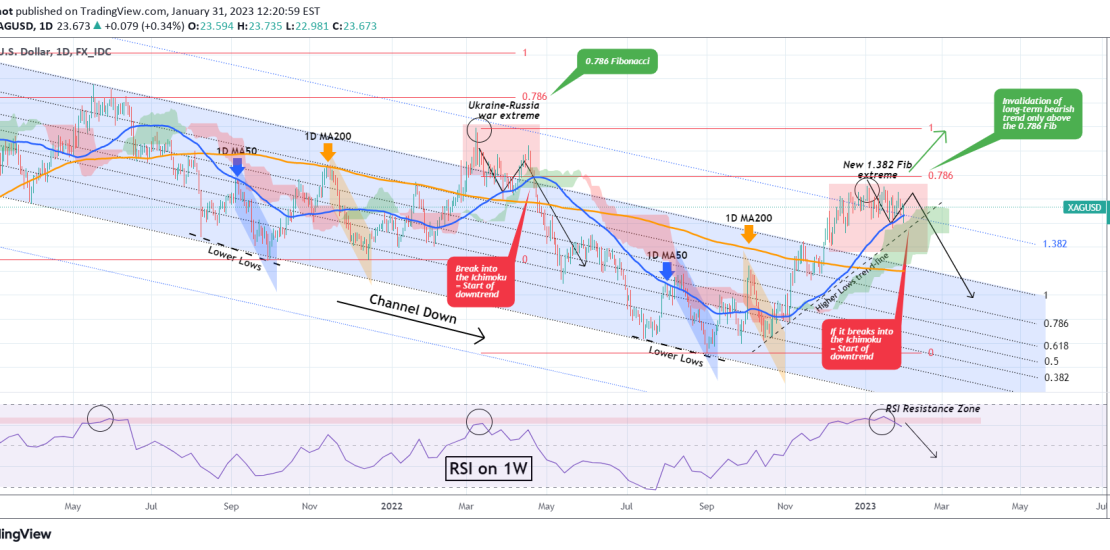
Silver (XAGUSD) couldn’t have gone better since our September 12 buy signal as following the Lower Lows Double Bottom, it not only broke above the 1D MA50 (blue trend-line) and 1D MA200 ( orange trend-line), but also made a new Extreme High on the 1.382 Fibonacci extension . As you see, we’ve charted Silver’s pattern
-
NASDAQ holding the 1 month pattern
- January 30, 2023
- Posted by: Tradingshot Articles
- Category: Stock Indices
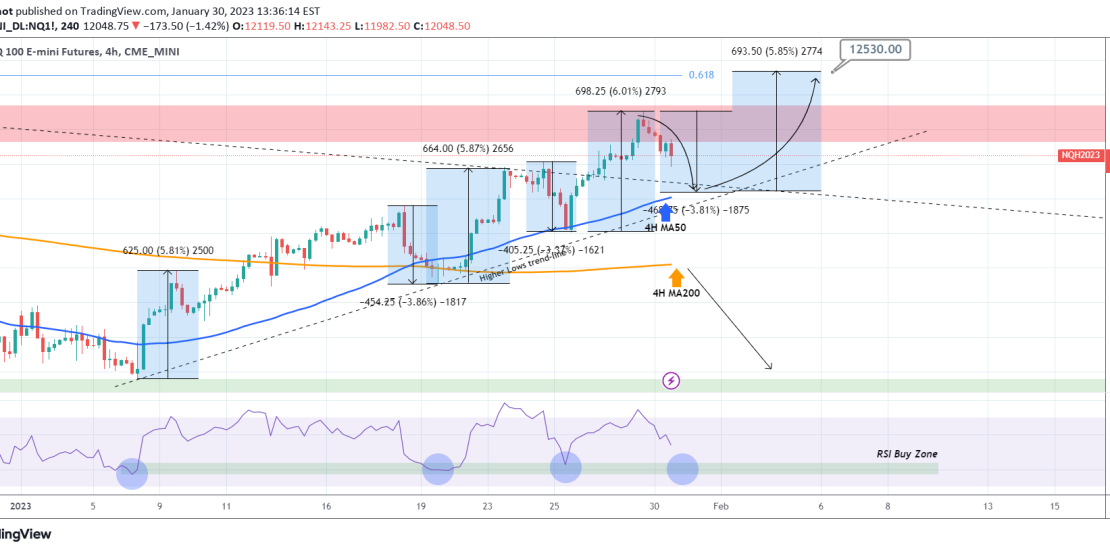
Nasdaq (NDX) is pull-back following Friday’s high. This is nothing more than a technical 1-month pattern which, supported by the 4H MA50 (blue trend-line) is posting rises around +6% and pull-backs around -3.5%. The 4H MA50 is currently a little over 11800 and a -3.80% pull-back (max on the pattern) can make exact contact with
-
BITCOIN The month is closing on an enormous buy signal
- January 30, 2023
- Posted by: Tradingshot Articles
- Category: Cryptocurrency
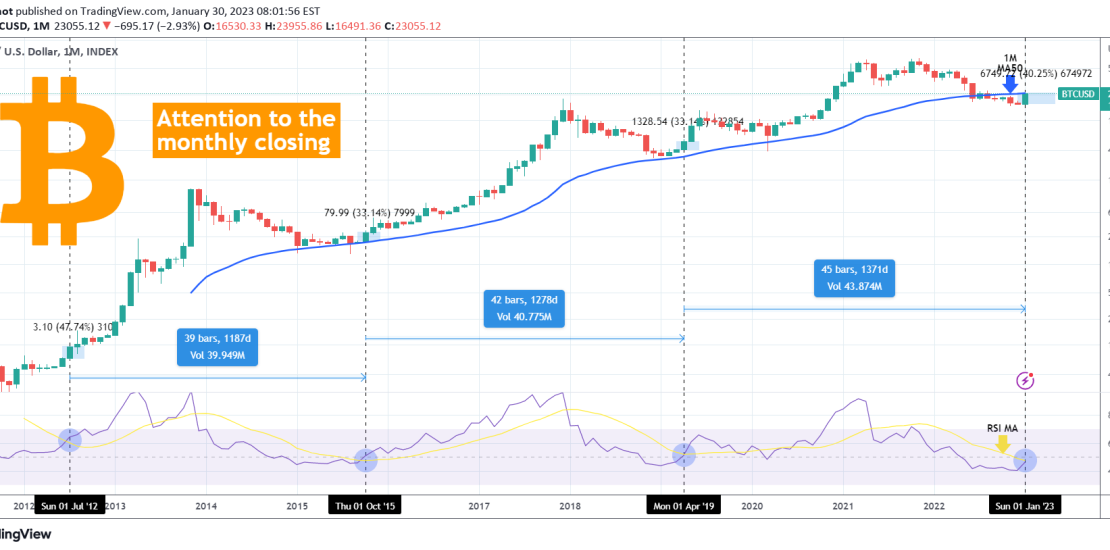
We only look at Bitcoin (BTCUSD) on the monthly time-frame when it is necessary to keep a long-term perspective and not miss the big picture. This is one of those times as the monthly (1M) candle, following January’s hyper strong rise and impressive start to the year, is now testing the 1M MA50 (blue trend-line).
-
NZDCAD High probability short when the 1D MA100 breaks
- January 27, 2023
- Posted by: Tradingshot Articles
- Category: Forex
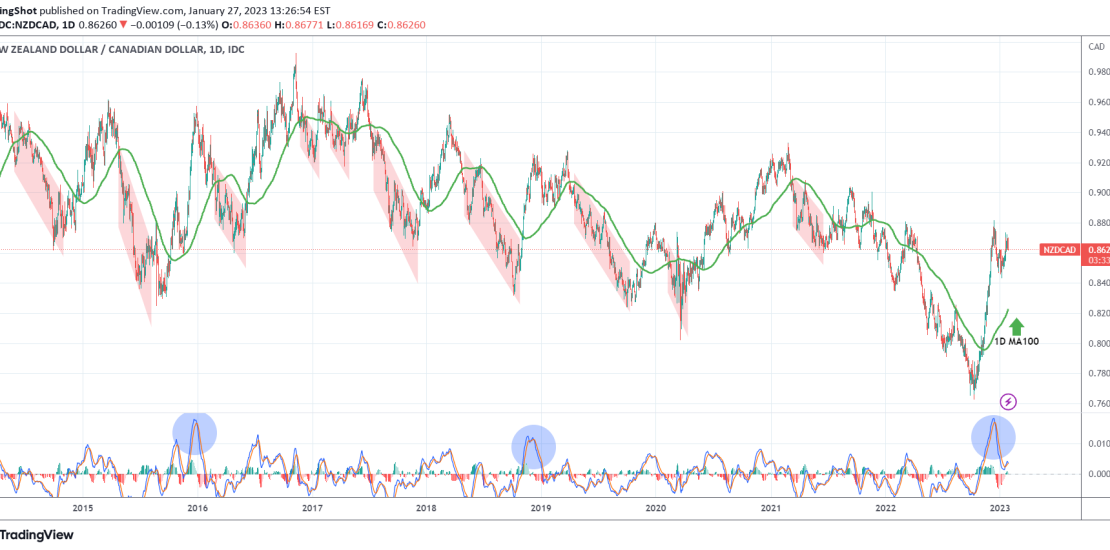
NZDCAD has turned sideways within a Triangle pattern in the past 30 days, showing the first signs of exhaustion on the incredible rally since October 11 2022. We don’t recommend buying this pair anymore but instead we can short with high probabilities of success when the 1D MA100 (green trend-line) breaks. As you see on
-
BITCOIN It’s blue-print is Gold and it is a bullish one.
- January 27, 2023
- Posted by: Tradingshot Articles
- Category: Cryptocurrency
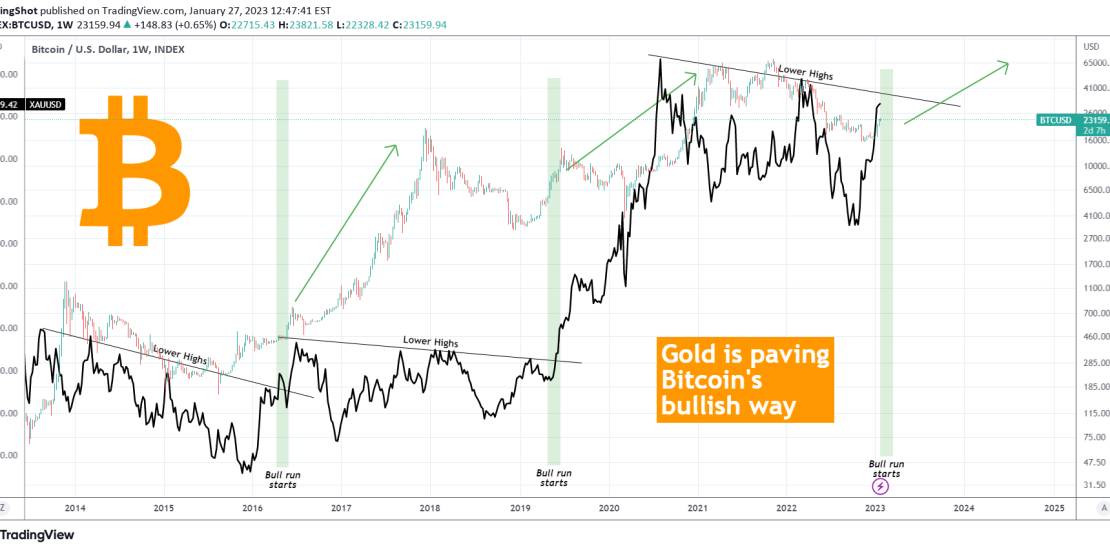
Bitcoin (BTCUSD) is displayed on this 1W chart alongside Gold (XAUUSD) by the black trend-line. The text will be short as the chart is pretty much self-explanatory. Every time Gold breaks its Lower Highs trend-line, BTC is past its bottom and well into its Bull Cycle, starting an aggressive rally. Right now Gold is dangerously
-
TESLA Above its 1D MA50, first time since September. 193 target.
- January 26, 2023
- Posted by: Tradingshot Articles
- Category: Stocks
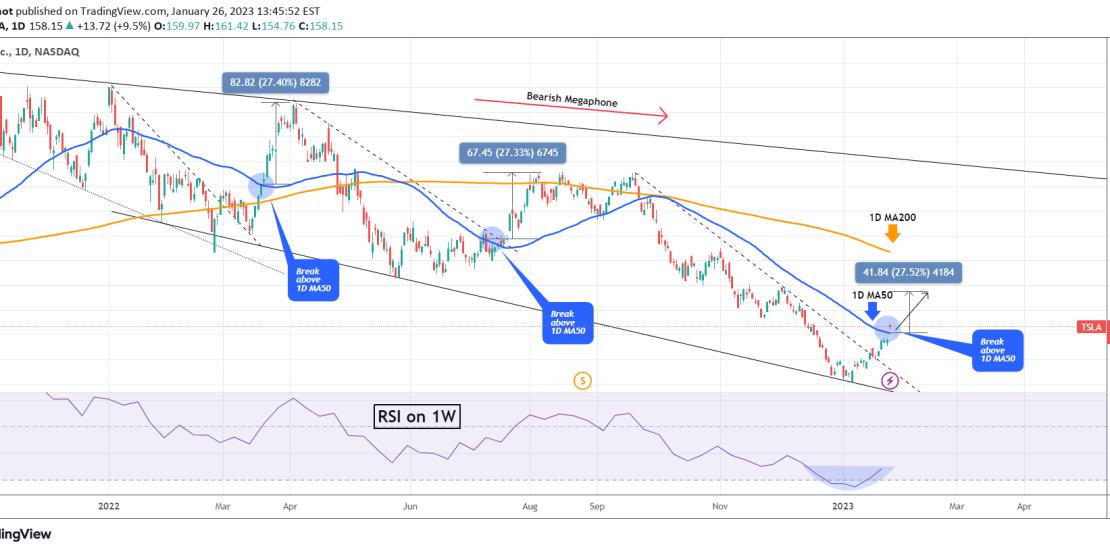
Tesla Inc (TSLA) broke today above its 1D MA50 (blue trend-line) for the first time since September 22 2022. This is a major bullish break-out on the medium-term as every time it did so inside the long-term Bearish Megaphone pattern, the price rose by around +27.50%. The 1W RSI is on a bullish reversal bottom
-
BITCOIN Yuan and China bond yields point to a mega rally!
- January 26, 2023
- Posted by: Tradingshot Articles
- Category: Cryptocurrency
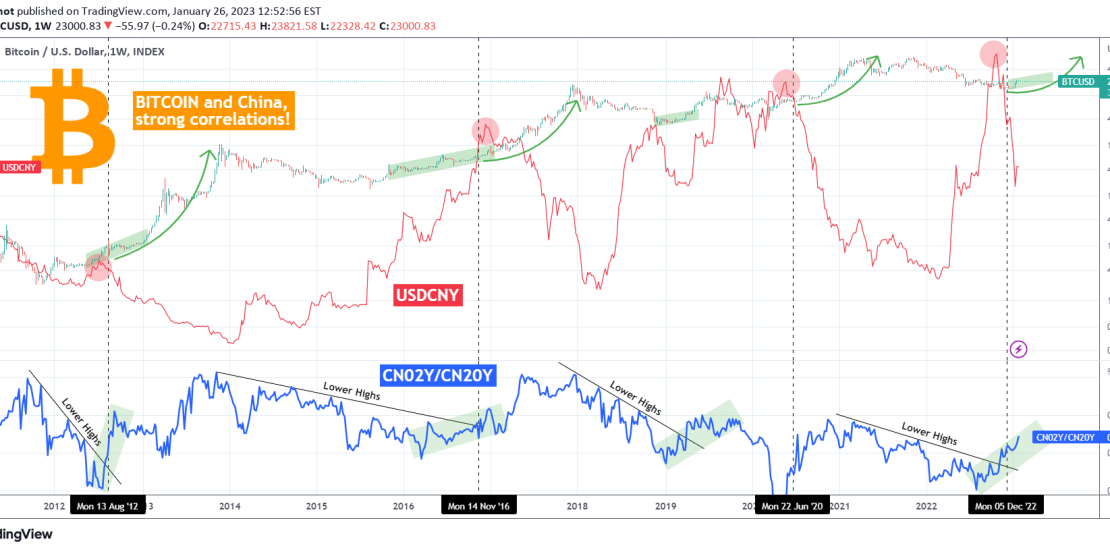
This is not the first time we emphasized the strong correlation of Bitcoin (BTCUSD) with Yuan (USDCNY) and the Chinese Bond Yields (CN02Y and CN20Y). We made an analysis right in the aftermath of the FTX crash, indicating why those indicators have all aligned, paving the way for BTC’s new Bull Cycle. As you see
-
GBPNZD Best long-term signal you’ll get
- January 26, 2023
- Posted by: Tradingshot Articles
- Category: Forex
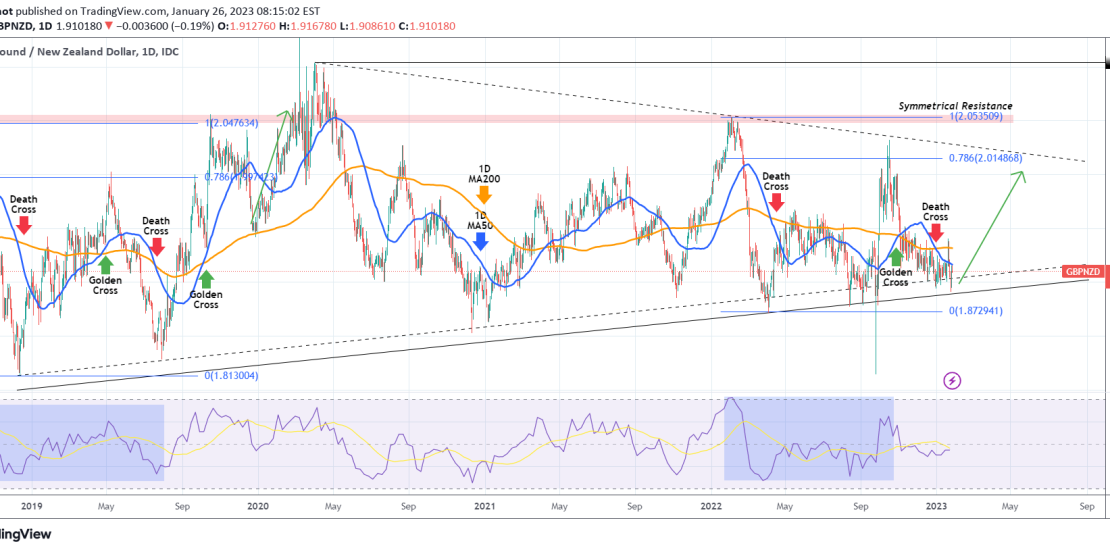
The GBPNZD pair hit the bottom of the Triangle pattern it has been trading in since early 2019. This has been done staight after a 1D Death Cross (when the blue 1D MA50 crosses below the orange 1D MA200). This is quite similar to the October 2018 – August 2019 fractal. A new Golden Cross
-
BITCOIN This is the Bullish Cross that will take it to $33k
- January 25, 2023
- Posted by: Tradingshot Articles
- Category: Cryptocurrency
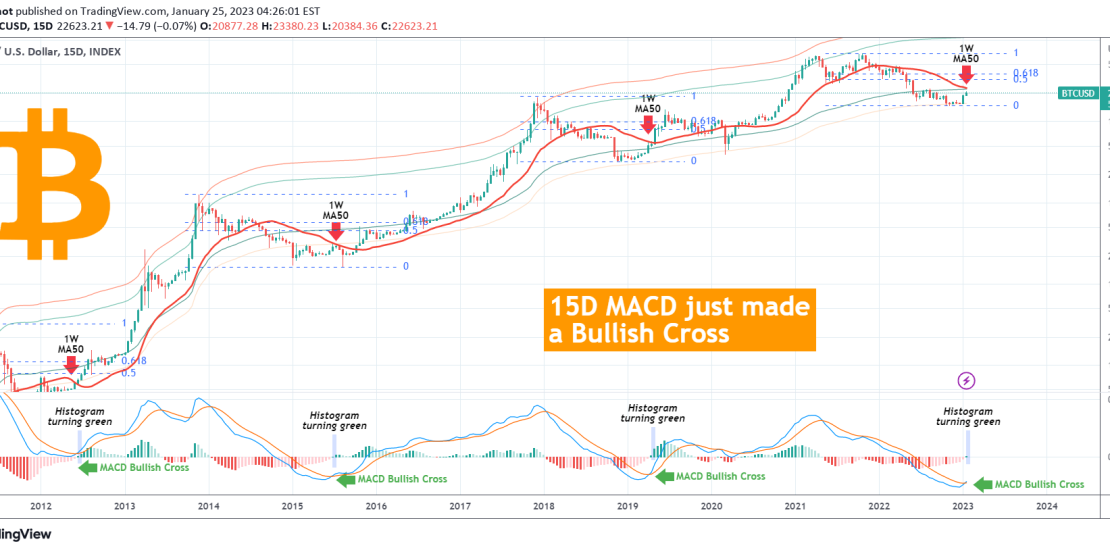
Bitcoin (BTCUSD) just made a hugely important and unique Bullish Cross on its LMACD. Those who follow us regularly over the years, know that we like looking into assets (and Bitcoin in particular) from different time-frames that provide a more spherical overview of the market and the direction. This time we analyze the 15D chart
-
BITCOIN Transition from a Wedge to an Inverse H&S showing 33.5k?
- January 24, 2023
- Posted by: Tradingshot Articles
- Category: Cryptocurrency
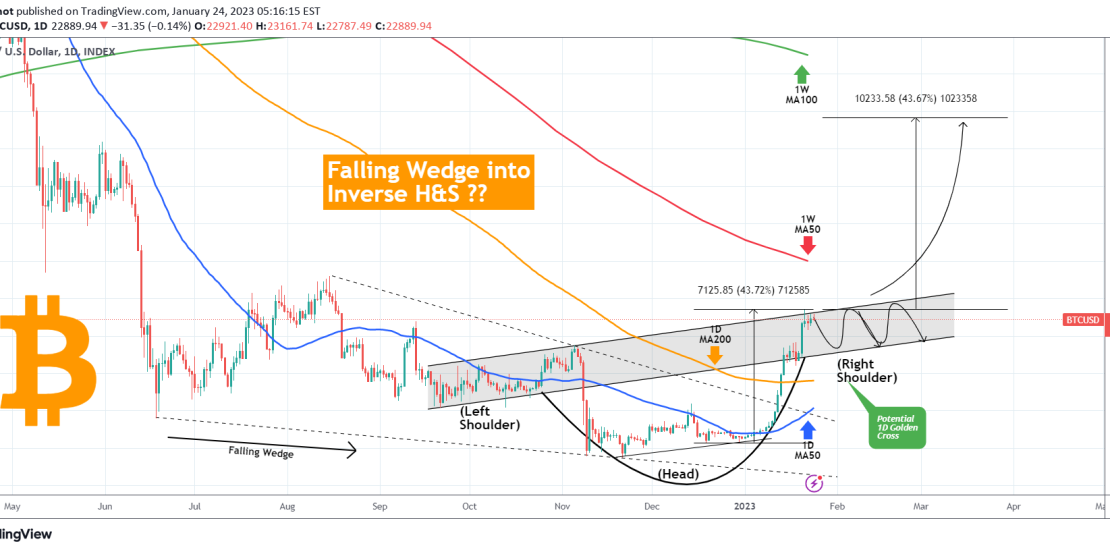
Bitcoin (BTCUSD) is up +40% since the start of the year and did so by breaking above its former Falling Wedge pattern that was holding since the June 18 2022 Low. On this 1D time-frame, we see that there is a high probability of the Wedge break-out to transition BTC into the next pattern that

