

- January 24, 2023
- Posted by: Tradingshot Articles
- Category: Cryptocurrency
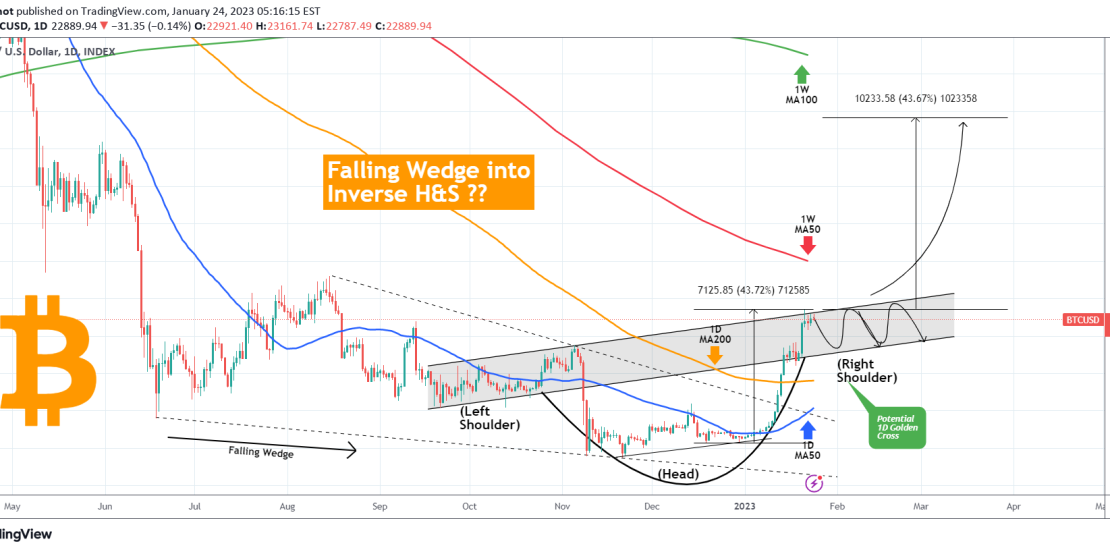
Bitcoin (BTCUSD) is up +40% since the start of the year and did so by breaking above its former Falling Wedge pattern that was holding since the June 18 2022 Low. On this 1D time-frame, we see that there is a high probability of the Wedge break-out to transition BTC into the next pattern that could be an Inverse Head and Shoulders (IH&S).
Such patterns are technically market bottom formations and initiate sharp recoveries. Right now the price is forming the Right Shoulder and could range within it as it did on the Left Shoulder. The rise after the completion of the Head until Saturday’s High is around +44%. After BTC breaks above its Right Shoulder, we can measure another +44% to find out the target of the IH&S pattern. At the moment that is a little over $33500.
By the time it reaches that level, it may coincide with a test of the all important 1W MA100 (green trend-line), which has been the last long-term Support that Bitcoin broke on May 06 2022.
If you are looking for confirmation of this move, keep an eye on the potential 1D Golden Cross (blue 1D MA50 crossing above the orange 1D MA200) and a break above the 1W MA50 (red trend-line), which has been untouched since April 05 2022.
So what do you think? Will we hit $33.5k that fast after the Inverse Head and Shoulders break? Feel free to let me know in the comments section below!
Tradingview link: