

- January 27, 2023
- Posted by: Tradingshot Articles
- Category: Forex
No Comments
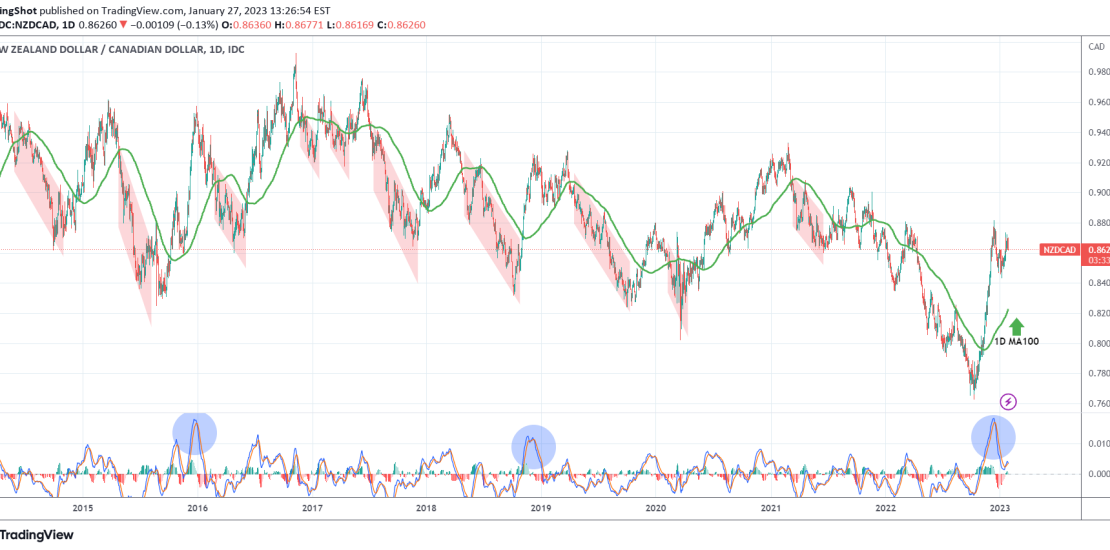
NZDCAD has turned sideways within a Triangle pattern in the past 30 days, showing the first signs of exhaustion on the incredible rally since October 11 2022. We don’t recommend buying this pair anymore but instead we can short with high probabilities of success when the 1D MA100 (green trend-line) breaks.
As you see on this chart, since 2015 every time the price broke below the 1D MA100 following a rally of similar magnitude, it always dropped significantly. This is our sell break-out signal.
Tradingview link: