

2022
-
GBPCHF Sell signal: Lower High and 1D MA200 rejection
- February 15, 2022
- Posted by: Tradingshot Articles
- Category: Forex
No Comments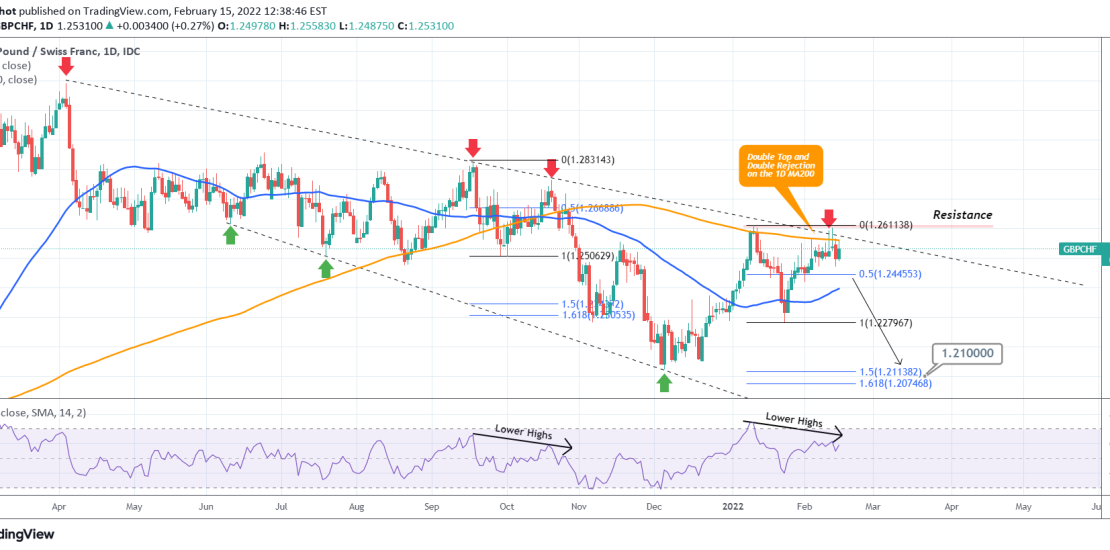
GBPCHF has been trading within a Bearish Megaphone pattern almost since the start of 2021. At the moment it is trading sideways for more than a week in a row but even though it has tested the 1D MA200 (orange trend-line) on multiple occasions, it has failed to close a 1D candle above it
-
XAUUSD Big upside potential
- February 9, 2022
- Posted by: Tradingshot Articles
- Category: Commodities
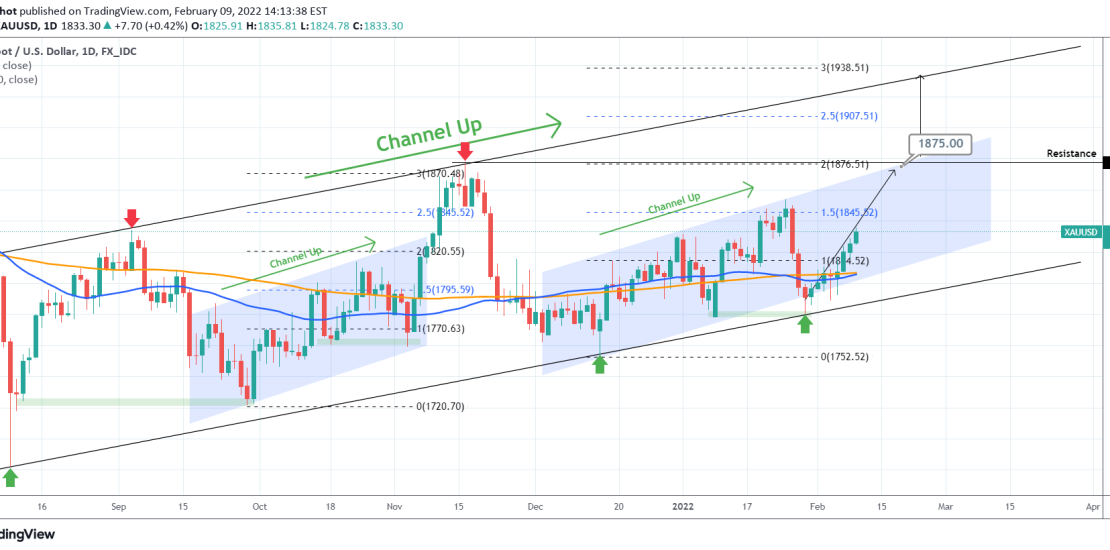
Gold is on a sustainable uptrend after holding the 1,780 Support following my buy update two weeks ago: This time I am putting things on a wider perspective and besides the two small Channel Up patterns, I’ve displayed the wider one that started with the August 09 2021 market bottom. As previously mentioned, the
-
GBPUSD Two month trading plan
- February 7, 2022
- Posted by: Tradingshot Articles
- Category: Forex
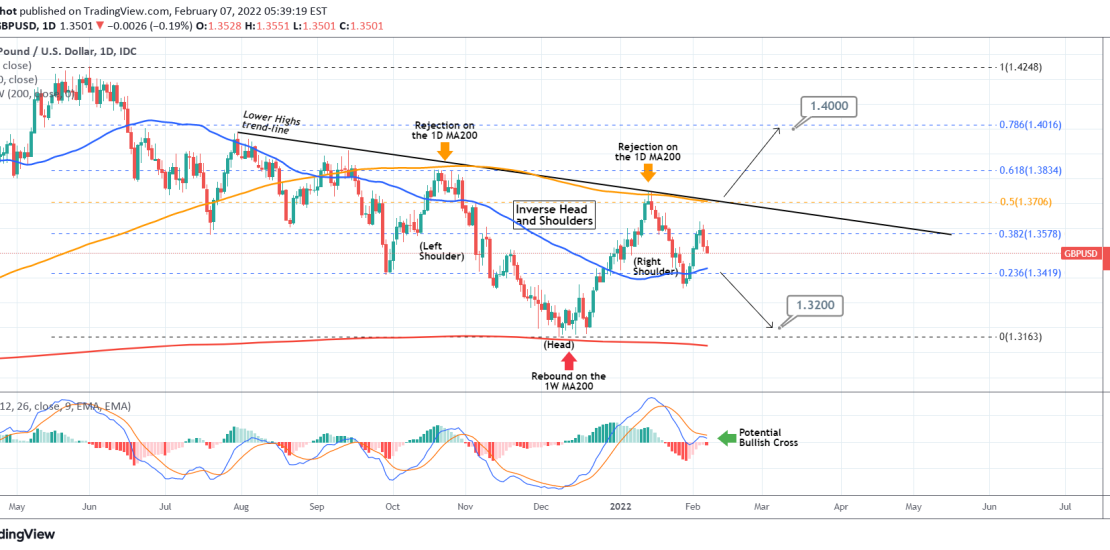
GBPUSD has formed an Inverse Head and Shoulders pattern on the 1D time-frame, which is technically a formation ahead of a bullish reversal. Before declaring a categorical long-term bullish shift, there are various Resistance levels to consider. First, as long as the Lower Highs trend-line since the July 30 2021 High is holding, which
-
CADJPY Buy Signal with structured targets
- February 3, 2022
- Posted by: Tradingshot Articles
- Category: Forex
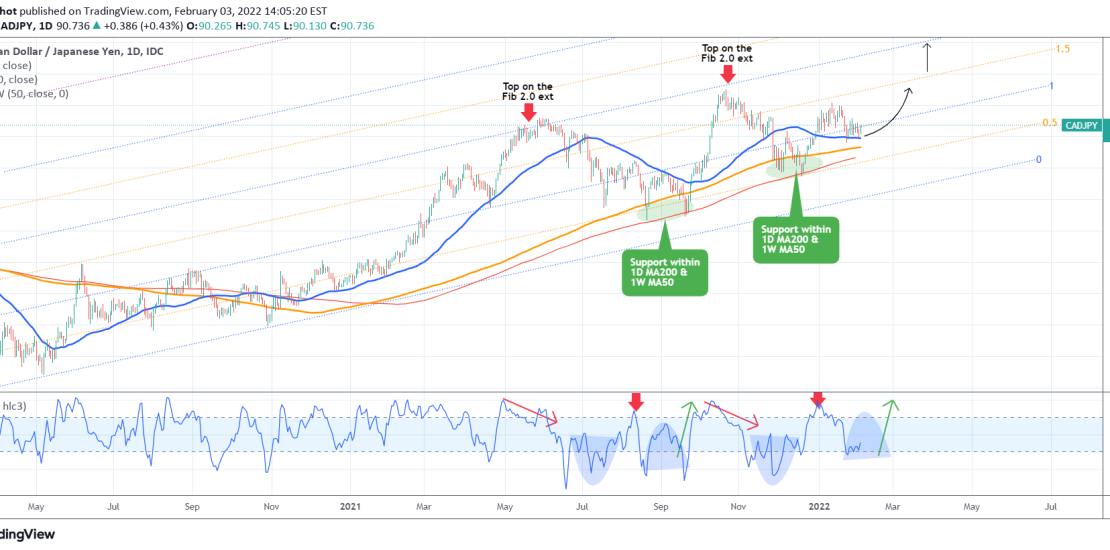
CADJPY has been trading on a Fibonacci Channel ever since the March 2020 COVID fueled market bottom. The bullish trend that followed has been gradually making Higher Highs on the next Fibonacci extension. Currently the last two Highs have been on the Fib 2.0 extension. The Support Zone of this pattern is constructed by
-
AUDCAD made a bottom and is targeting the 1D MA200.
- February 1, 2022
- Posted by: Tradingshot Articles
- Category: Forex
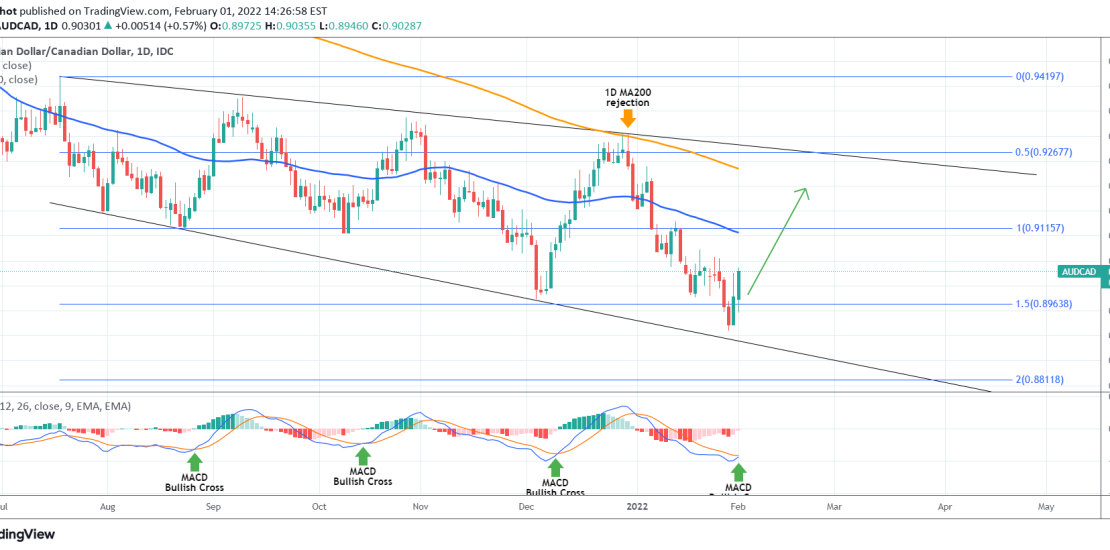
Pattern: Bearish Megaphone on the 1D time-frame. Signal: Buy as the price hit the bottom (Lower Lows trend-line) of the Megaphone while the 1D MACD is about to print a Bullish Cross, which since August has signaled a rise. Target: The 1D MA200 with a rough projection at 0.9200. Tradingview link: https://www.tradingview.com/chart/AUDCAD/6qlcLz6j-AUDCAD-made-a-bottom-and-is-targeting-the-1D-MA200
-
CHFJPY Buy Signal
- February 1, 2022
- Posted by: Tradingshot Articles
- Category: Forex
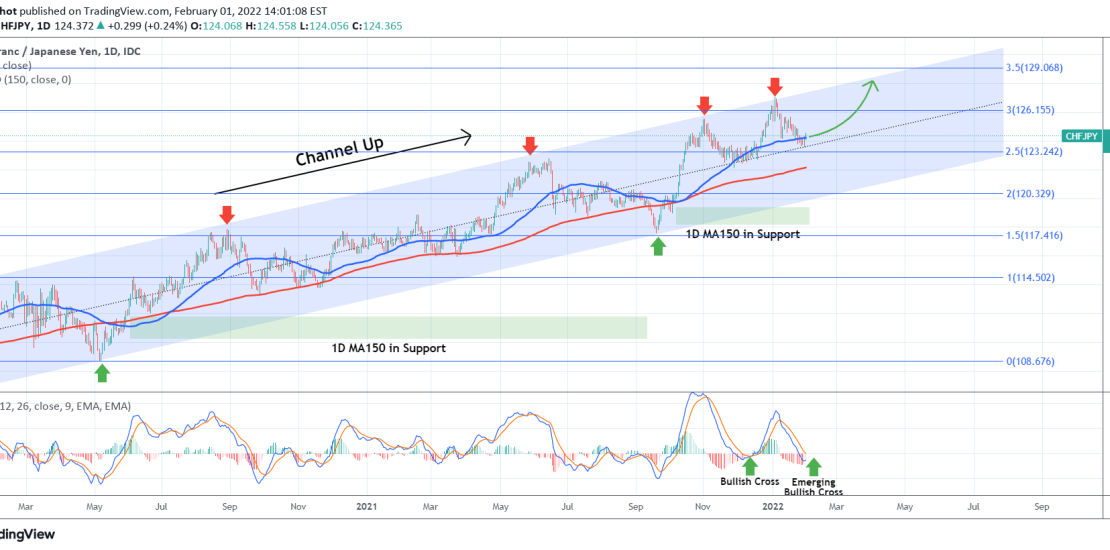
Pattern: Channel Up on the 1D time-frame since early 2020. Signal: Buy as long as the 1D MA150 (red trend-line) is supporting. Before the September market bottom (Higher Low), the 1D MA150 has been in Support for 1 year and 100 days. A MACD Bullish Cross should confirm the rise. Target: 128.000 (just below
-
NASDAQ Channel Down emerged. Trade the rejection or break-out.
- January 31, 2022
- Posted by: Tradingshot Articles
- Category: Stock Indices
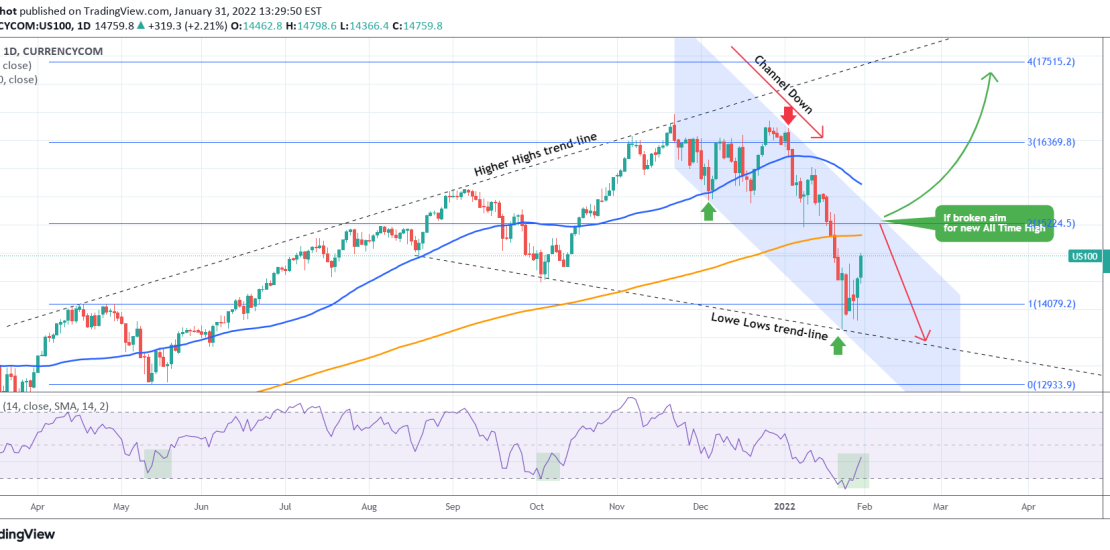
Nasdaq has suffered the most during January’s correction. The Lower Lows created a new Channel Down which we have to consider, despite having the 1D RSI make a rebound from oversold levels and a bottom formation similar to early October, mid-May and early March 2021. The 1D MA200 (orange trend-line) is the first natural
-
EURJPY Buy opportunity on Higher Lows
- January 28, 2022
- Posted by: Tradingshot Articles
- Category: Forex
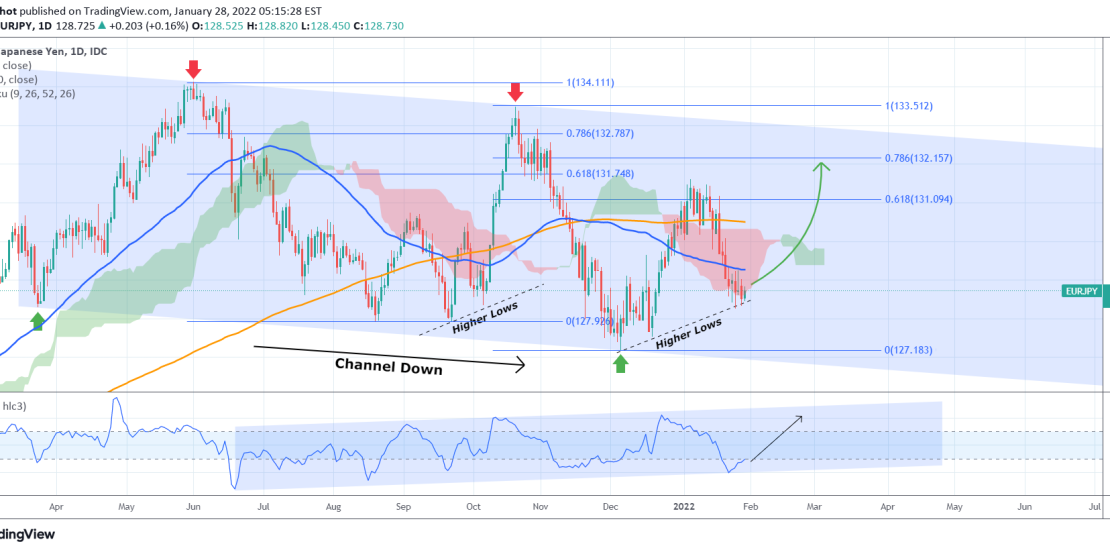
EURJPY has been trading within a long-term Channel Down since the June 01 2021 market top. Since January 05 2022 it has seen a strong downfall within this wide pattern but this week could have found Support on this internal Higher Lows trend-line (dashed) as it turned sideways. The 1D MA50 (blue trend-line) is
-
XAUUSD Channel Up + 1 extra Support towards 1875
- January 27, 2022
- Posted by: Tradingshot Articles
- Category: Commodities
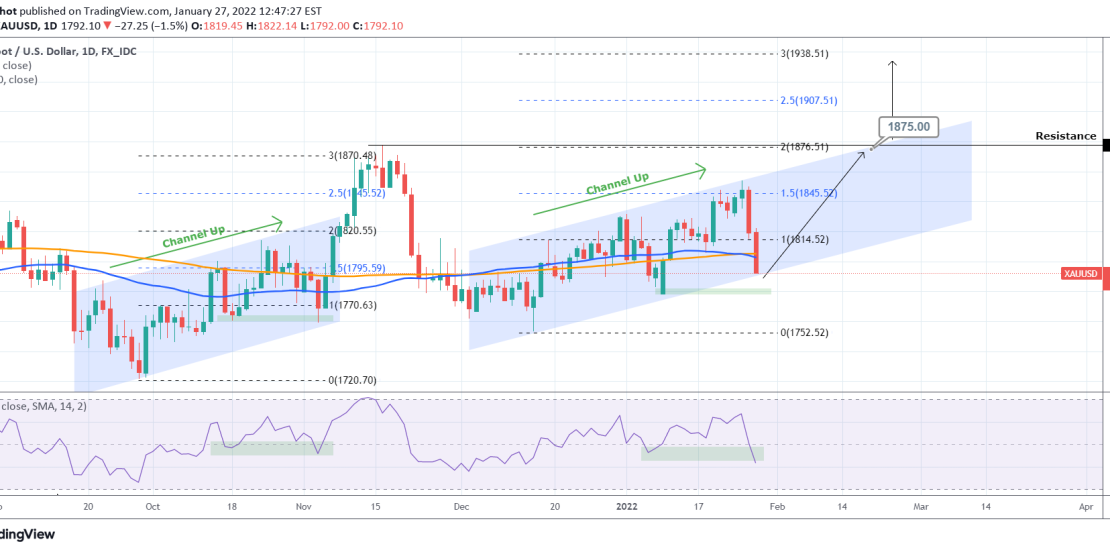
Gold is being sold aggressively following Powell’s comments on the expected inflation yesterday, despite being considered a counter-inflation asset. Technically that sell-off can be attributed to the chart I posted 1 week ago on the selling pressure that the top of the long-term Triangle applies: On the shorter term and the 1D time-frame, Gold
-
S&P500 ended the U.S elections rally. Years of volatility ahead?
- January 25, 2022
- Posted by: Tradingshot Articles
- Category: Stock Indices
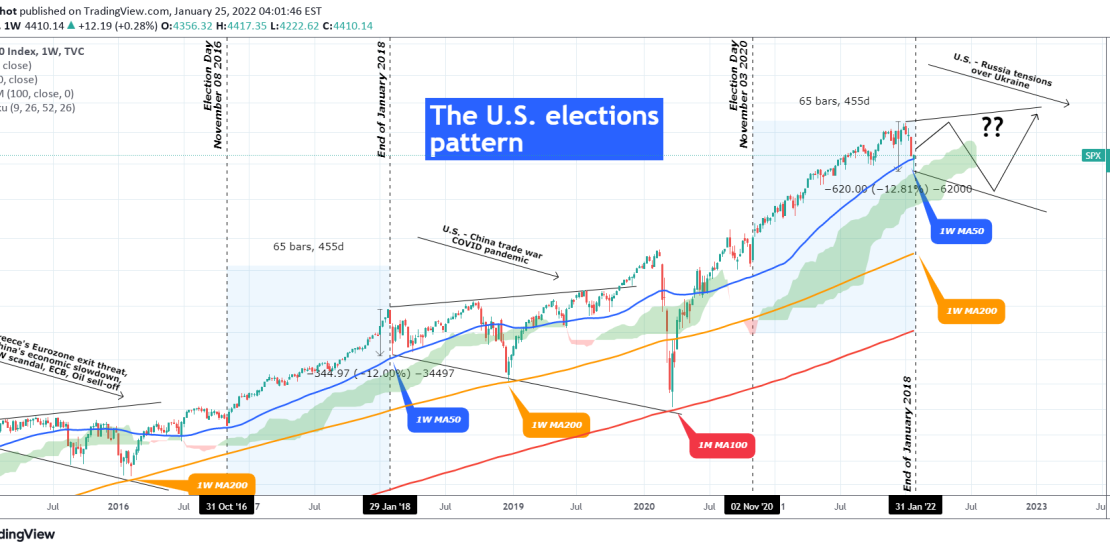
This is the S&P500 index on the 1W time-frame (on the log scale). The recent sell-off (-12% so far) is leaving many wondering what is happening and rightly so as it broke below the very strong bullish pattern (Higher Highs/ Higher Lows) since the November 2020 U.S. elections. As I looked more closely into it