

- February 7, 2022
- Posted by: Tradingshot Articles
- Category: Forex
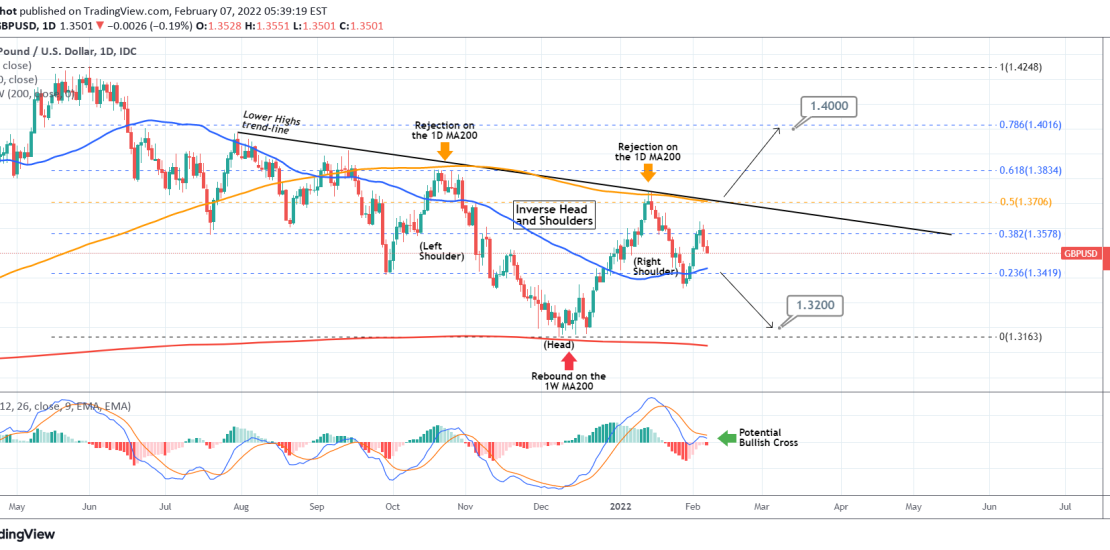
GBPUSD has formed an Inverse Head and Shoulders pattern on the 1D time-frame, which is technically a formation ahead of a bullish reversal. Before declaring a categorical long-term bullish shift, there are various Resistance levels to consider.
First, as long as the Lower Highs trend-line since the July 30 2021 High is holding, which is also where the 1D MA200 (orange trend-line) is exactly, the pair remains bearish and another break below the 1D MA50 (blue trend-line) could target the 1.3165 Low again.
If the price breaks above the Lower Highs and 1D MA200, I expect a Higher High near the 0.786 Fibonacci retracement level (1.400). There are two dynamic parameters that push the probabilities a little more to the bullish case. First the 1D MACD that is close to a Bullish Cross and second but more important, the fact that the December 08 Low (and Head of the Inverse Head and Shoulders pattern) was made exactly on the 1W MA200 (red trend-line). The fact that the price rebounded on such an important long-term Support, could be decisive in turning the pair bullish for the next 2-3 months.
Tradingview link:
https://www.tradingview.com/chart/GBPUSD/z7IvfNJq-GBPUSD-Two-month-trading-plan