

2022
-
MKRUSDT Rejected on the 1D MA200. Bearish unless this breaks.
- October 10, 2022
- Posted by: Tradingshot Articles
- Category: Cryptocurrency
No Comments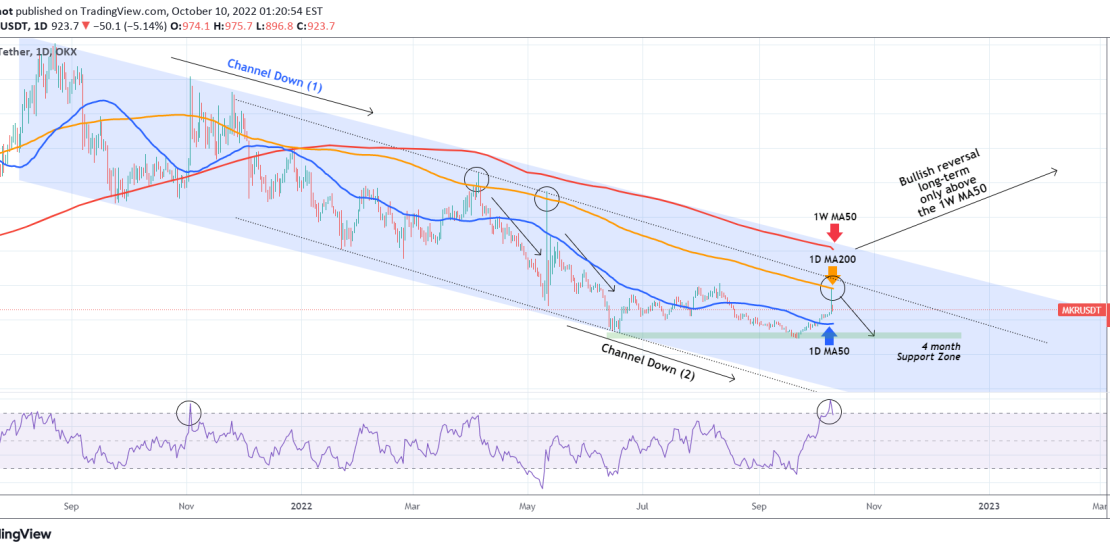
*** *** For this particular analysis on Maker we are using the MKRUSDT symbol on the OKX exchange. *** *** The idea is on the 1D time-frame where MKR is shown trading on its long-term bearish pattern which is a Channel Down (1) since August 23 2021 High. There is also a diverging Channel Down (2) that started
-
DAX Broke the 4H MA50. Bearish extension.
- October 8, 2022
- Posted by: Tradingshot Articles
- Category: Stock Indices
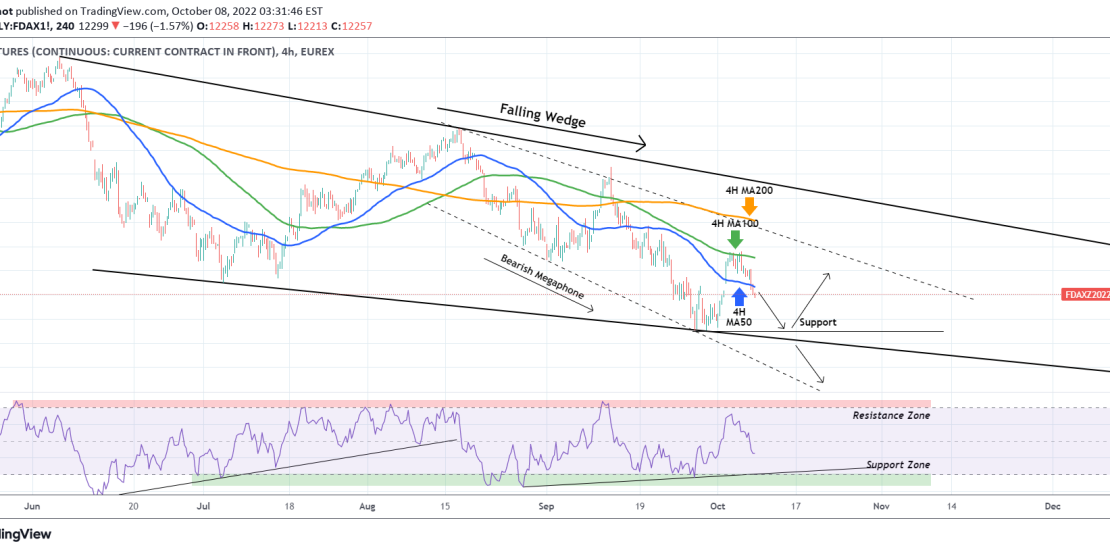
The German stock index (DAX) broke below its 4H MA50 (blue trend-line) on Friday after failed to break and being rejected on the 4H MA100 (green trend-line) earlier this week. This keeps the price inside both the short-term Bearish Megaphone pattern and the longer term Falling Wedge pattern. That break is a major sell
-
SILVER Can’t rise more unless this level breaks
- October 8, 2022
- Posted by: Tradingshot Articles
- Category: Commodities

Silver (XAGUSD) has been pulling back in the last 3 days following an impressive +18% rise since the September 28 Low. As you see, we’ve charted Silver’s pattern since February 01 2021, which is a Channel Down, most effectively viewed using the Fibonacci channel levels. This is basically the pattern we used to analyze
-
OKBUSDT Death Cross can be bullish? The full picture.
- October 7, 2022
- Posted by: Tradingshot Articles
- Category: Cryptocurrency
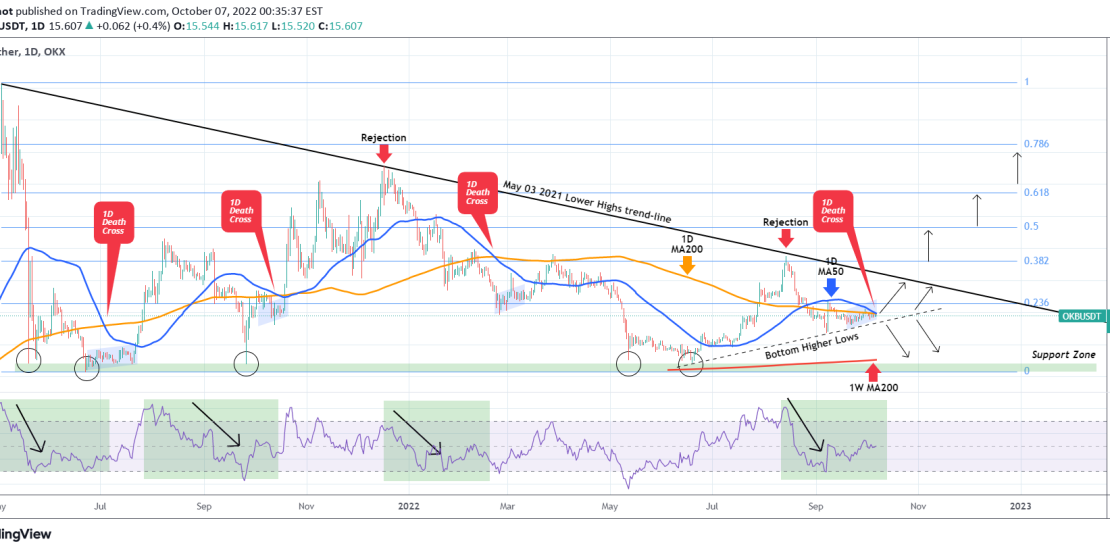
The OKB token (OKBUSDT) is the Global Utility Token that was launched by the OK Blockchain Foundation and OKX exchange in 2017, to serve as a bridge to connect OKX and its users. On this post, we will analyze how current pattern may be bullish short-term against popular belief and how it may play
-
XAUUSD First time to hit the 1D MA50 in 1.5 month. What next?
- October 5, 2022
- Posted by: Tradingshot Articles
- Category: Commodities
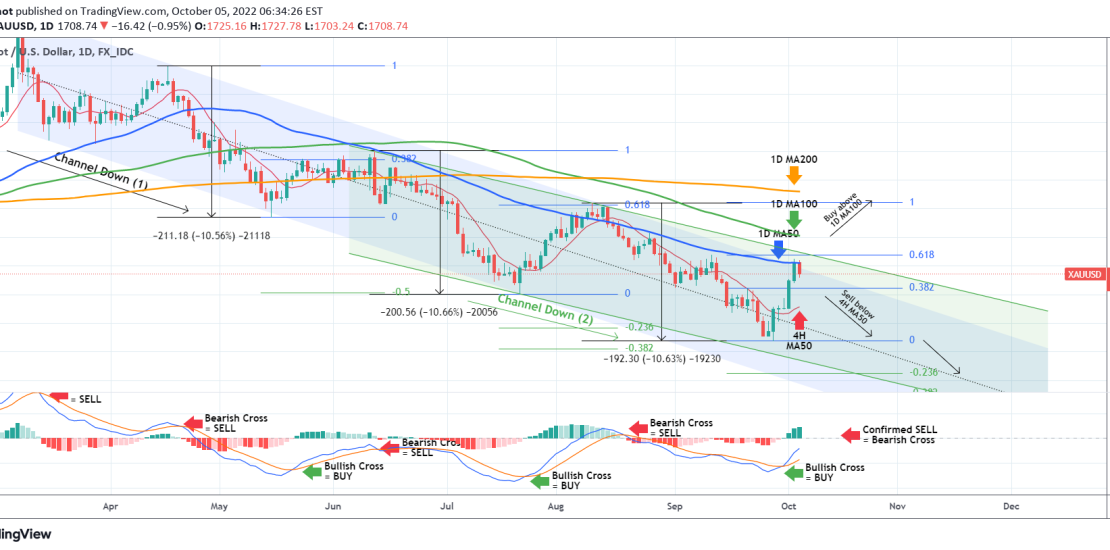
Last week (September 28) we posted our usual 1D Gold (XAUUSD) analysis, calling for a buy after the metal completed a -10.60% drop from its previous Channel Down High: As you see the price action validated that projection and Gold finally hit yesterday the 1D MA50 (blue trend-line), which was our immediate target. That
-
EURUSD Hit the 4H MA200 after 21 days. Rejection or break-out?
- October 4, 2022
- Posted by: Tradingshot Articles
- Category: Forex
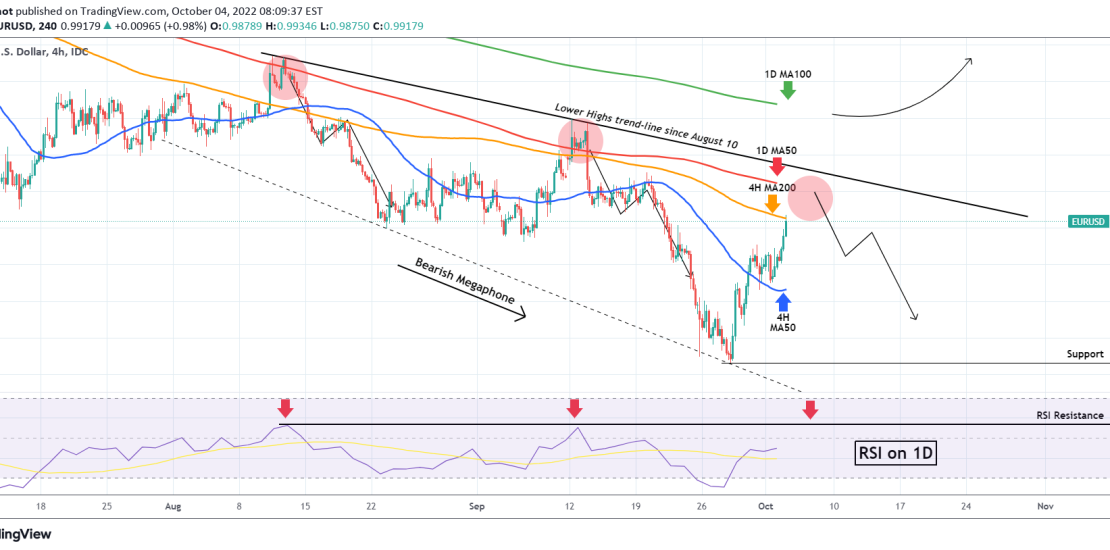
The EURUSD pair largely confirmed our Buy Signal given on our last week analysis at the bottom of the multi-month Channel Down: The price turned sideways after breaking above the 4H MA50 (blue trend-line) last Thursday, turning it now into a Support and hit the 4H MA200 (orange trend-line) for the first time since
-
WTI OIL Bullish break-out on the short-term
- October 3, 2022
- Posted by: Tradingshot Articles
- Category: Commodities
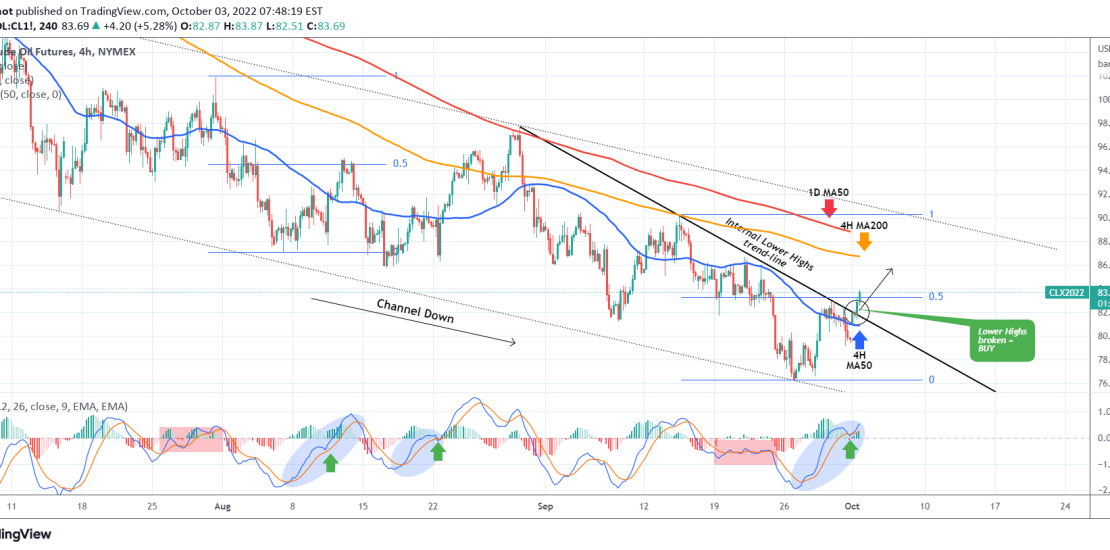
The WTI OIL (CL1! used on this analysis), broke today above the Internal Lower Highs trend-line that started on the last Lower High (August 30) of the long-term Channel Down pattern. By doing so, the price turned the 4H MA50 (blue trend-line) into a Support and technically targets the 4H MA200 (orange trend-line) as
-
CADCHF 1 year Support + Channel Down bottom
- September 30, 2022
- Posted by: Tradingshot Articles
- Category: Forex
The CADCHF pair hit for the second time in 7 days the 1 year Support Zone that has been holding since the August 20 2021 Low. This Zone has provided three rebounds in total. At the same time the price is near the bottom of the Channel Down pattern that started after the June
-
NZDCAD Short-term buy and break-out levels
- September 28, 2022
- Posted by: Tradingshot Articles
- Category: Forex
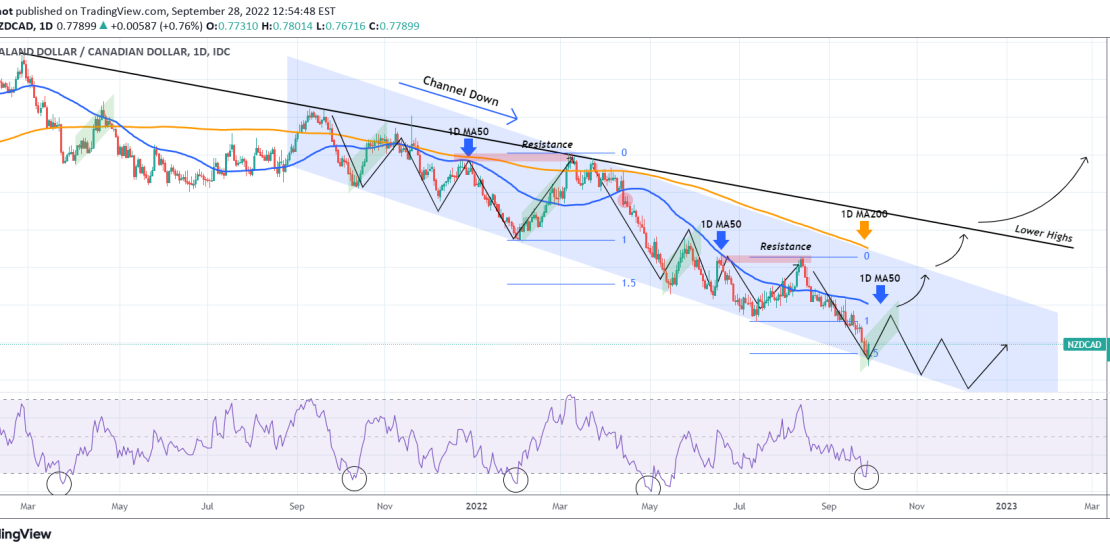
The NZDCAD pair has been following a very specific trading pattern which we have outlined since June and has given us excellent trades: As you see the key here is a recurring bearish sequence within this Channel Down. As long as the 1D MA50 (blue trend-line) is intact as the Resistance, expect Lower
-
GBPCAD The RSI hasn’t been this oversold since 1985!
- September 28, 2022
- Posted by: Tradingshot Articles
- Category: Forex
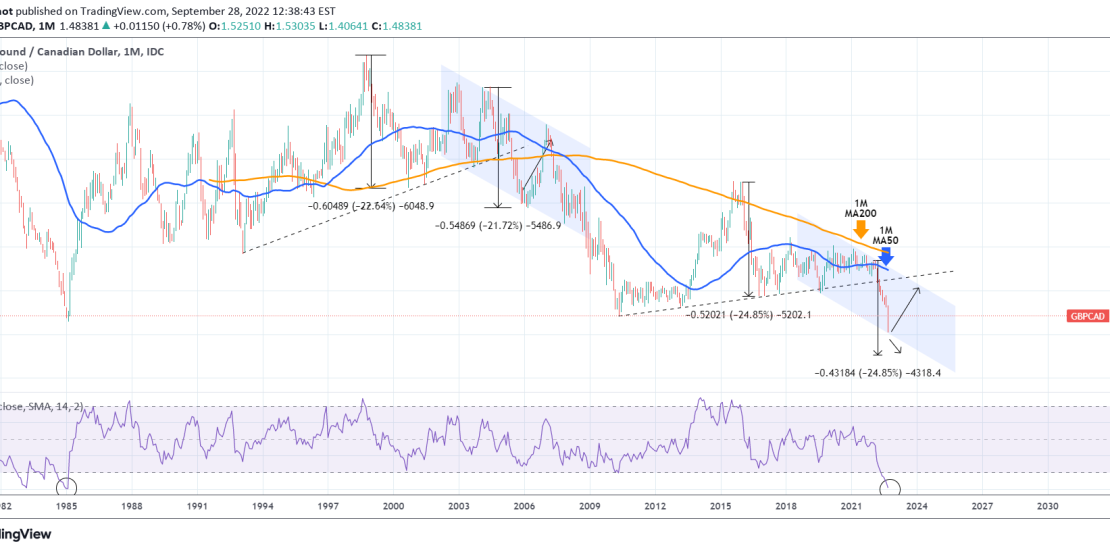
The GBPCAD pair has been on a strong yearly decline, especially as of late. The 1M (monthly) RSI is currently at 20.87, the lowest it has been since January 1985. That is a good enough reason of its own to buy the pair. There are striking resemblances with the early 2000s fractal. A rebound