

- October 3, 2022
- Posted by: Tradingshot Articles
- Category: Commodities
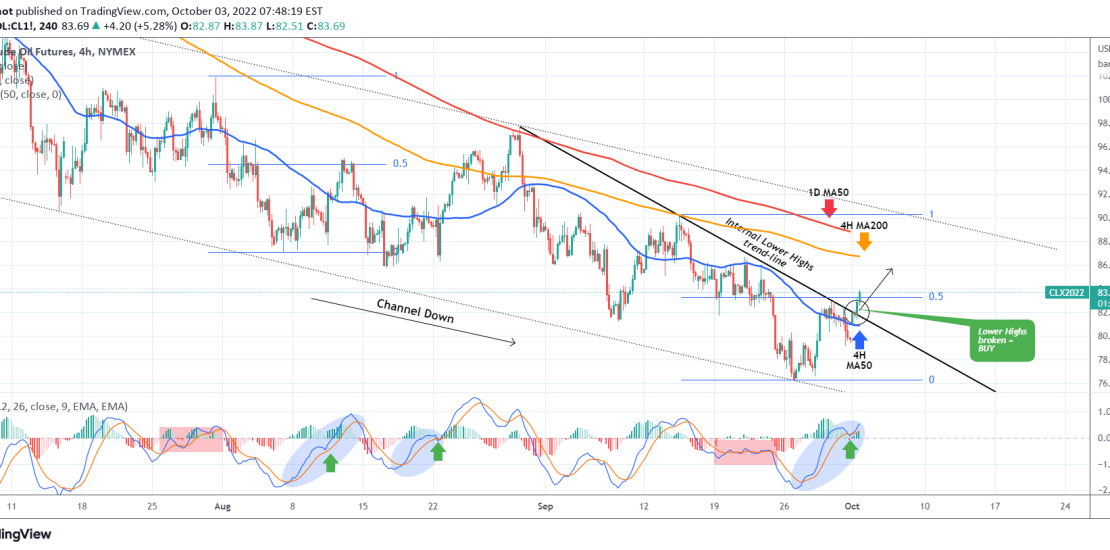
The WTI OIL (CL1! used on this analysis), broke today above the Internal Lower Highs trend-line that started on the last Lower High (August 30) of the long-term Channel Down pattern. By doing so, the price turned the 4H MA50 (blue trend-line) into a Support and technically targets the 4H MA200 (orange trend-line) as it did on September 14.
At the same time, it invalidated a Bearish Cross on the 4H MACD. A similar pattern has been on August 22, when the price again broke aggressively above the 4H MA50 after having plunged below it. That leg also hit the 4H MA200. However, the rise may be less than expected if it replicates the August 10 break-out, which was contained on the 0.5 Fibonacci level, which is where we are at now. You may consider closing then if we close below the 4H MA50.
Tradingview link:
https://www.tradingview.com/chart/CL1!/LZA436Ot-WTI-OIL-Bullish-break-out-on-the-short-term