2021 September
-
GBPUSD close to the Channel Down bottom. Buy signal.
- September 30, 2021
- Posted by: Tradingshot Articles
- Category: Forex
No Comments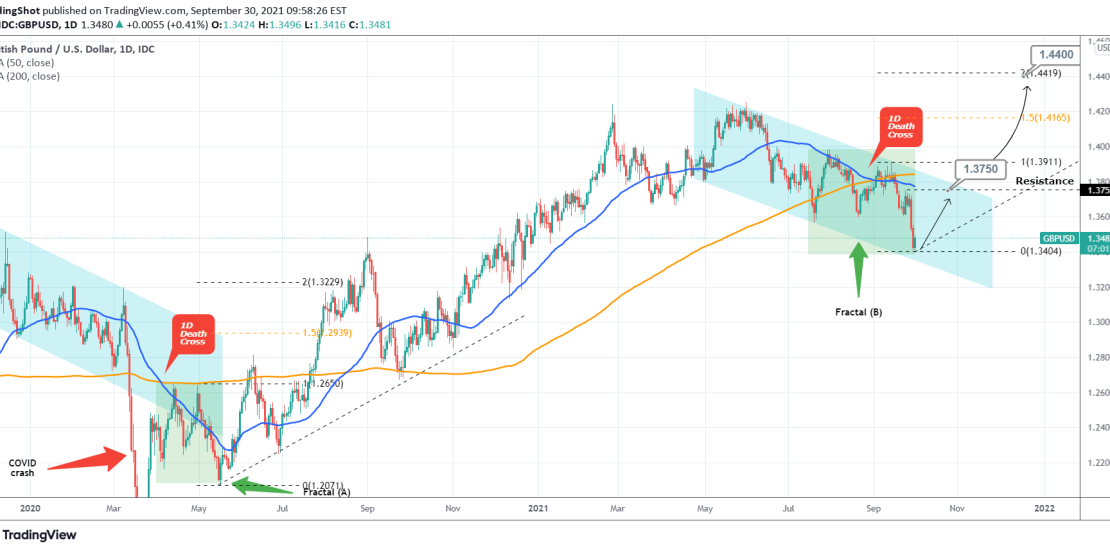
The pair has been trading within a Channel Down since April 30. Today it is rebounding after coming the closest to the bottom (Lower Lows trend-line) of the Channel Down since July 20. This is a short-term buy signal on its own with a 1.3750 Target (the short-term Resistance). On a more longer term
-
XAUUSD targeting $1800
- September 30, 2021
- Posted by: Tradingshot Articles
- Category: Commodities
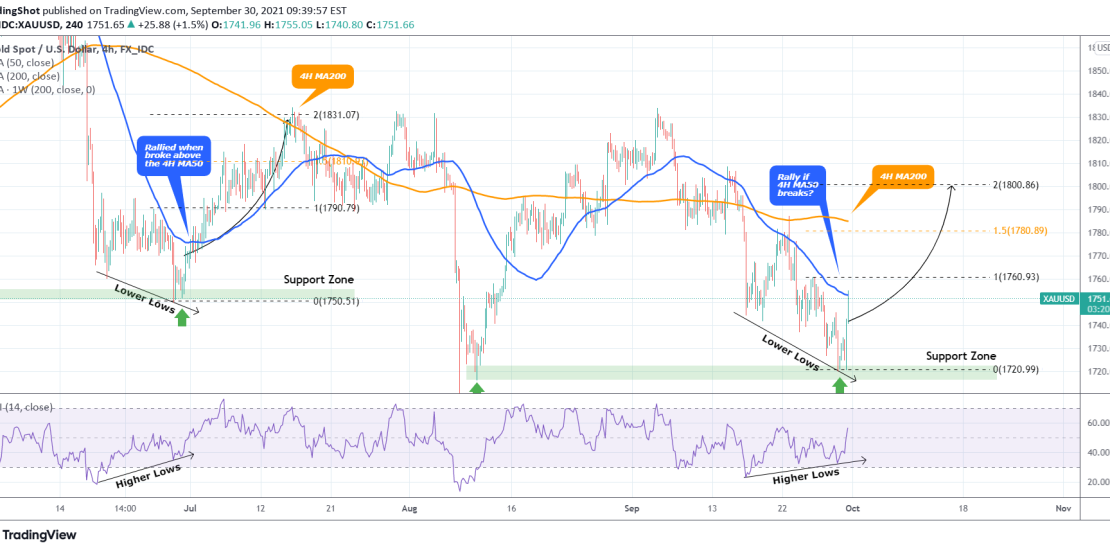
The price is now testing the 4H MA50 (blue trend-line) for the first time in a week. As mentioned on my most recent post, a 1D candle closing above 1747, would mean the start of a rebound. As you see the current fractal is trading on an identical pattern with the June 18-30 sequence.
-
BITCOIN Moment of truth after China ban. Which Channel prevails?
- September 24, 2021
- Posted by: Tradingshot Articles
- Category: Cryptocurrency
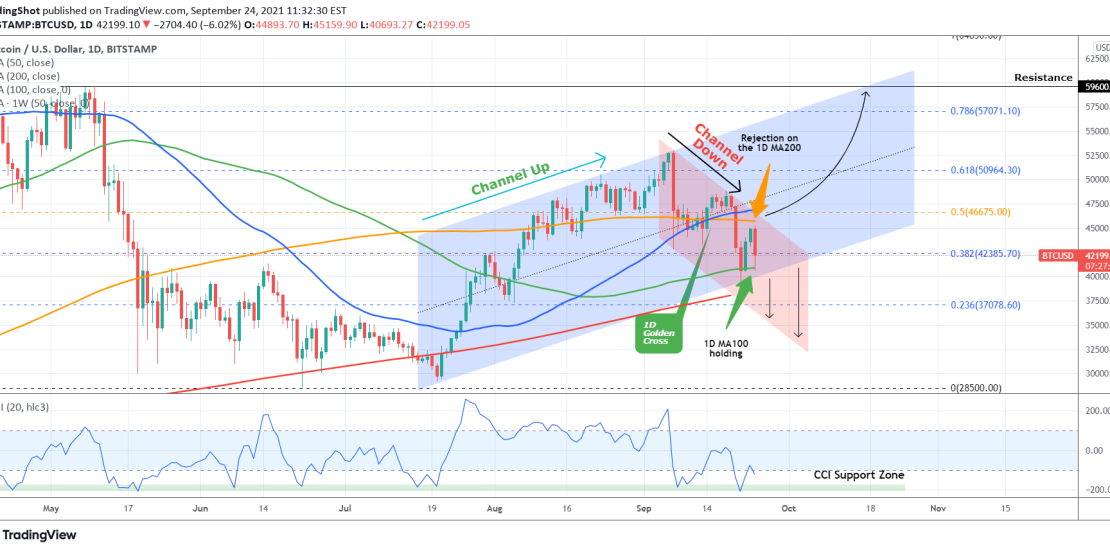
Bitcoin is on the back foot again, suffering significant losses following the new round of China bans on crypto trading. Although the market has faced (successfully) this threat before (even recently) and is not something unfamiliar, traders need to consider mostly the psychological effect this may have to weak hands. Technically though there are
-
DAX Buy Signal
- September 22, 2021
- Posted by: Tradingshot Articles
- Category: Stock Indices
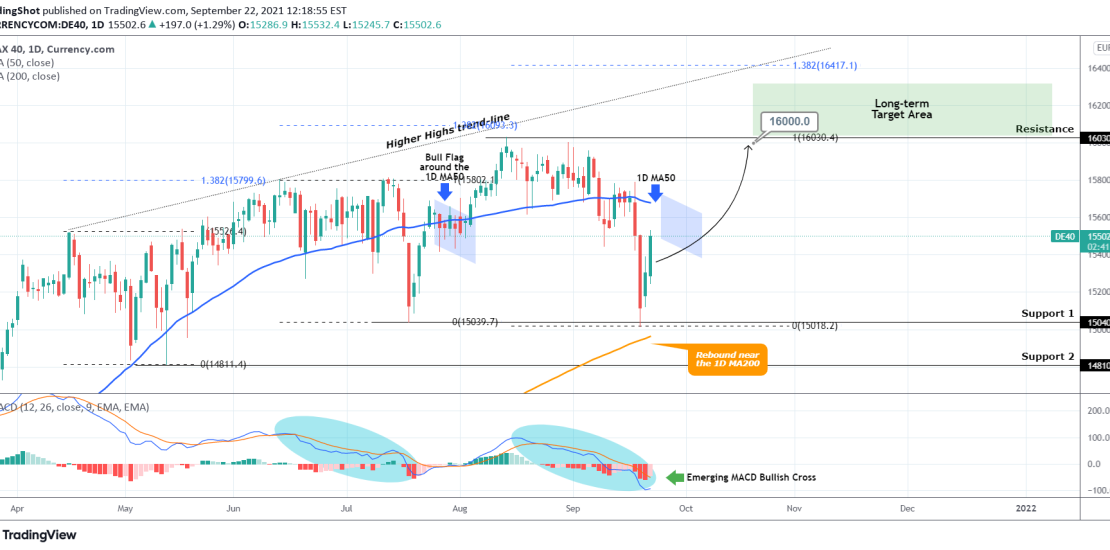
DAX is rebounding after approaching two key pressure levels: the 1D MA200 (orange trend-line) and the 15040 Support (1). Last time the price rebounded on the level, it topped at 16,030 (current Resistance) after consolidated within a mini Bull Flag around the 1D MA50 (blue trend-line). The Flag signal is the MACD Bullish Cross
-
DOW JONES near the 1D MA200/ first time since October 2020!
- September 21, 2021
- Posted by: Tradingshot Articles
- Category: Stock Indices
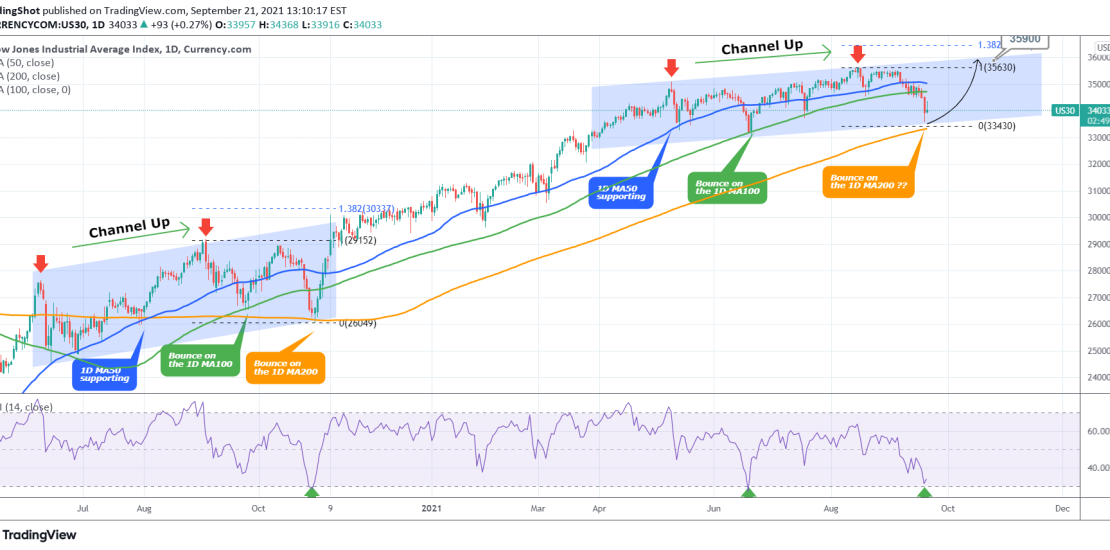
Dow Jones is trading within a Channel Up that has recently broken below the 1D MA100 (green trend-line). This is the first time in two months that is giving the first strong buy signals: * The RSI is near the 30.000 level which has marked price bottoms on June 18 2021, October 29 2020
-
NASDAQ Start looking for a buy near the 1D MA100 after the Fed
- September 21, 2021
- Posted by: Tradingshot Articles
- Category: Stock Indices
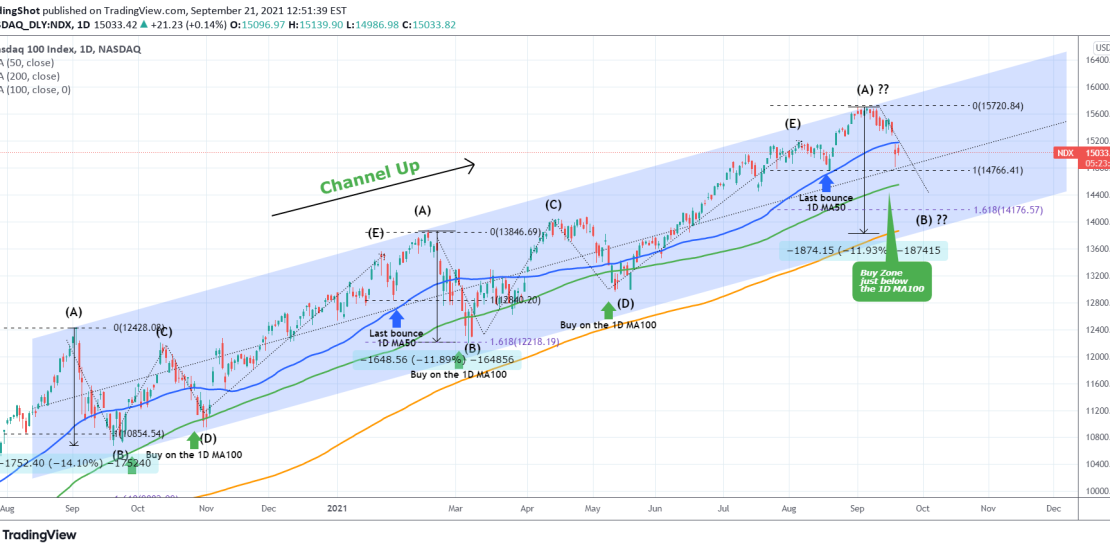
Two weeks ago NDX formed a peak formation at the top of the multi-month Channel Up (Higher Highs) and I posted the following chart calling for a strong correction: As you see that correction is currently underway and having broken below the 1D MA50 (blue trend-line) is looking for the patterns strongest Support, the
-
WTI OIL Inverse Head and Shoulders
- September 17, 2021
- Posted by: Tradingshot Articles
- Category: Commodities
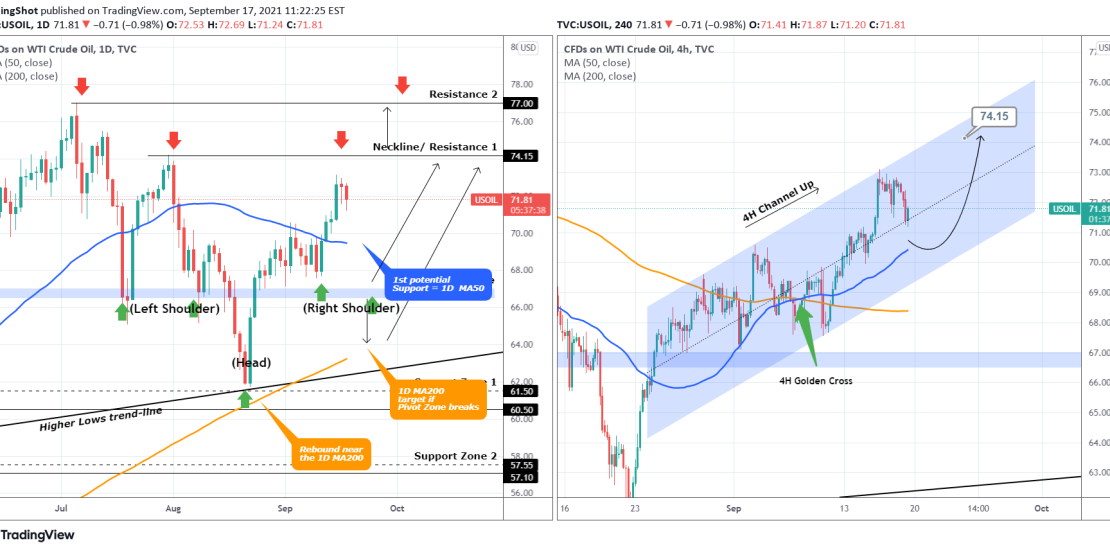
Last time I made a post on WTI Oil the price was still struggling to get past both a very strong Lower Highs trend-line and the 1D MA50 (blue trend-line on the left chart): Well the price managed to break and close above both and rallied. The rejection though near the 74.15 Resistance has
-
APPLE Further correction ahead
- September 14, 2021
- Posted by: Tradingshot Articles
- Category: Uncategorized
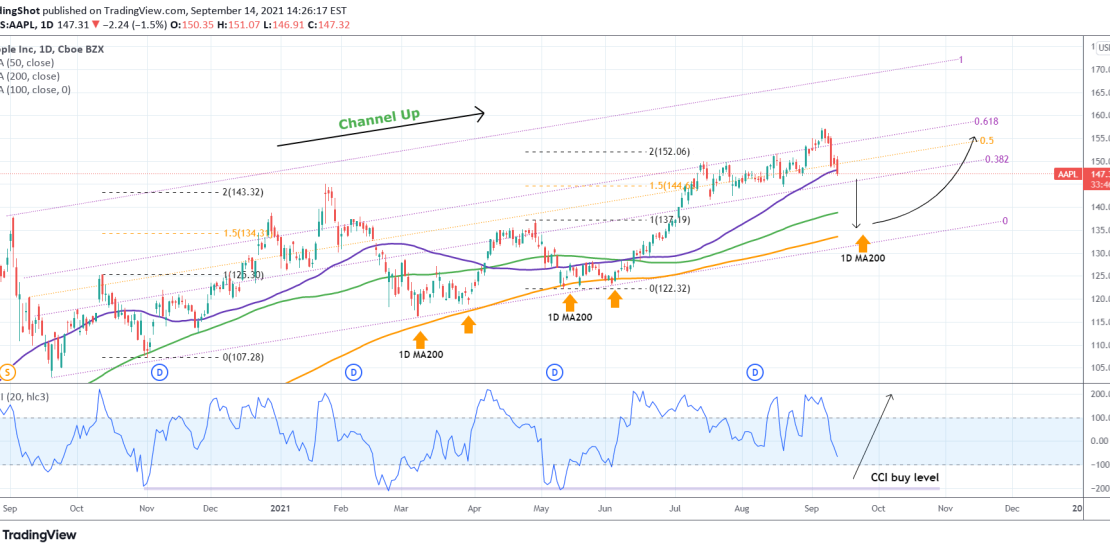
Pattern: Channel Up on 1D. Signal: Sell towards the 1D MA200 (orange trend-line) and reverse to a buy either upon contact (buy signal last time) or when the CCI hits its Buy Zone (confirmed 3 times since November 2020). Target: the 0.618 Fibonacci level. Tradingview link: https://www.tradingview.com/chart/AAPL/ppQOeczO-APPLE-Further-correction-ahead
-
BITCOIN Is it realistic to expect a repeat of this fractal?
- September 10, 2021
- Posted by: Tradingshot Articles
- Category: Cryptocurrency
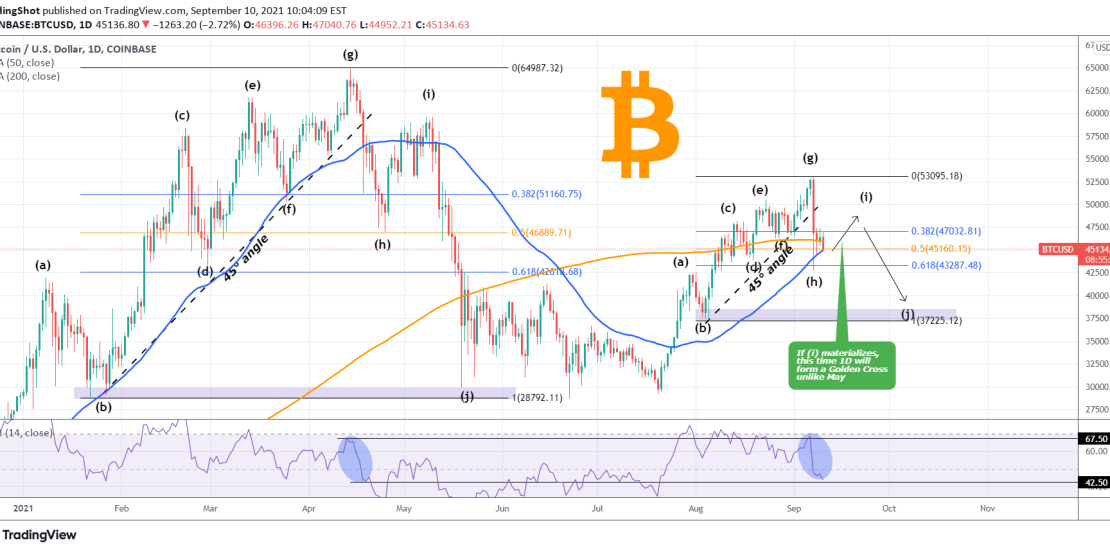
If you followed me for long here on TradingView and on reddit in the past, then you know I am a big supporter of fractal analysis. As a result I had to bring you today’s fractal comparison and will explain how it can be invalidated even though so far it has been astonishingly identical.
-
NASDAQ initiating a strong correction?
- September 8, 2021
- Posted by: Tradingshot Articles
- Category: Stock Indices
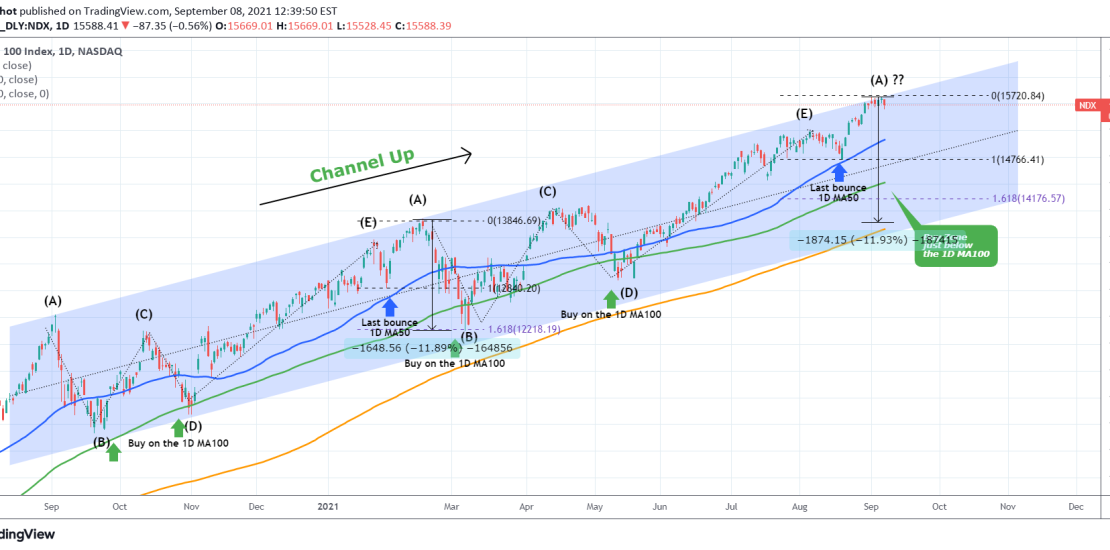
This idea is a continuation to my analysis posted on August 26: It appears that the leg count and the similarities (so far) of the current price action with the January-February sequence was correct. If the pattern continues to replicate in the same way, then Nasdaq is ahead of a strong correction as this
- 1
- 2

